Q1 2026 13F Final Tally: Which Early Signals Held and What Only the Full Universe Revealed

The May 15 deadline is past. All 8,572 institutional managers have reported their Q1 2026 holdings. With the full universe in, the early-filer signals can be tested at scale — and a quieter structural finding shows up alongside them: across nearly every active theme, the largest 87 managers (the index shops and market-makers who hold most of the $63 trillion in reported AUM) barely moved at all. The signals worth reading came from the rest.
In early April we wrote up the first 193 filers, and on April 20 we revisited the data at roughly 15% coverage. Both samples skewed toward smaller managers — RIAs and regional banks file early. The largest asset managers file in the final week before the deadline. The early signals could have been a small-manager artifact, a real consensus, or somewhere between. With the full data, we can sort them out.
All percentages below refer to the full institutional universe — the count of managers holding the security in Q1 2026 versus the same count in Q4 2025. Where the bifurcation between the largest managers and the rest matters, it's called out. A side-by-side table at the bottom shows where the full-universe number understates what active managers actually did.
Energy: every major name added holders
The early energy call held across every segment we looked at.
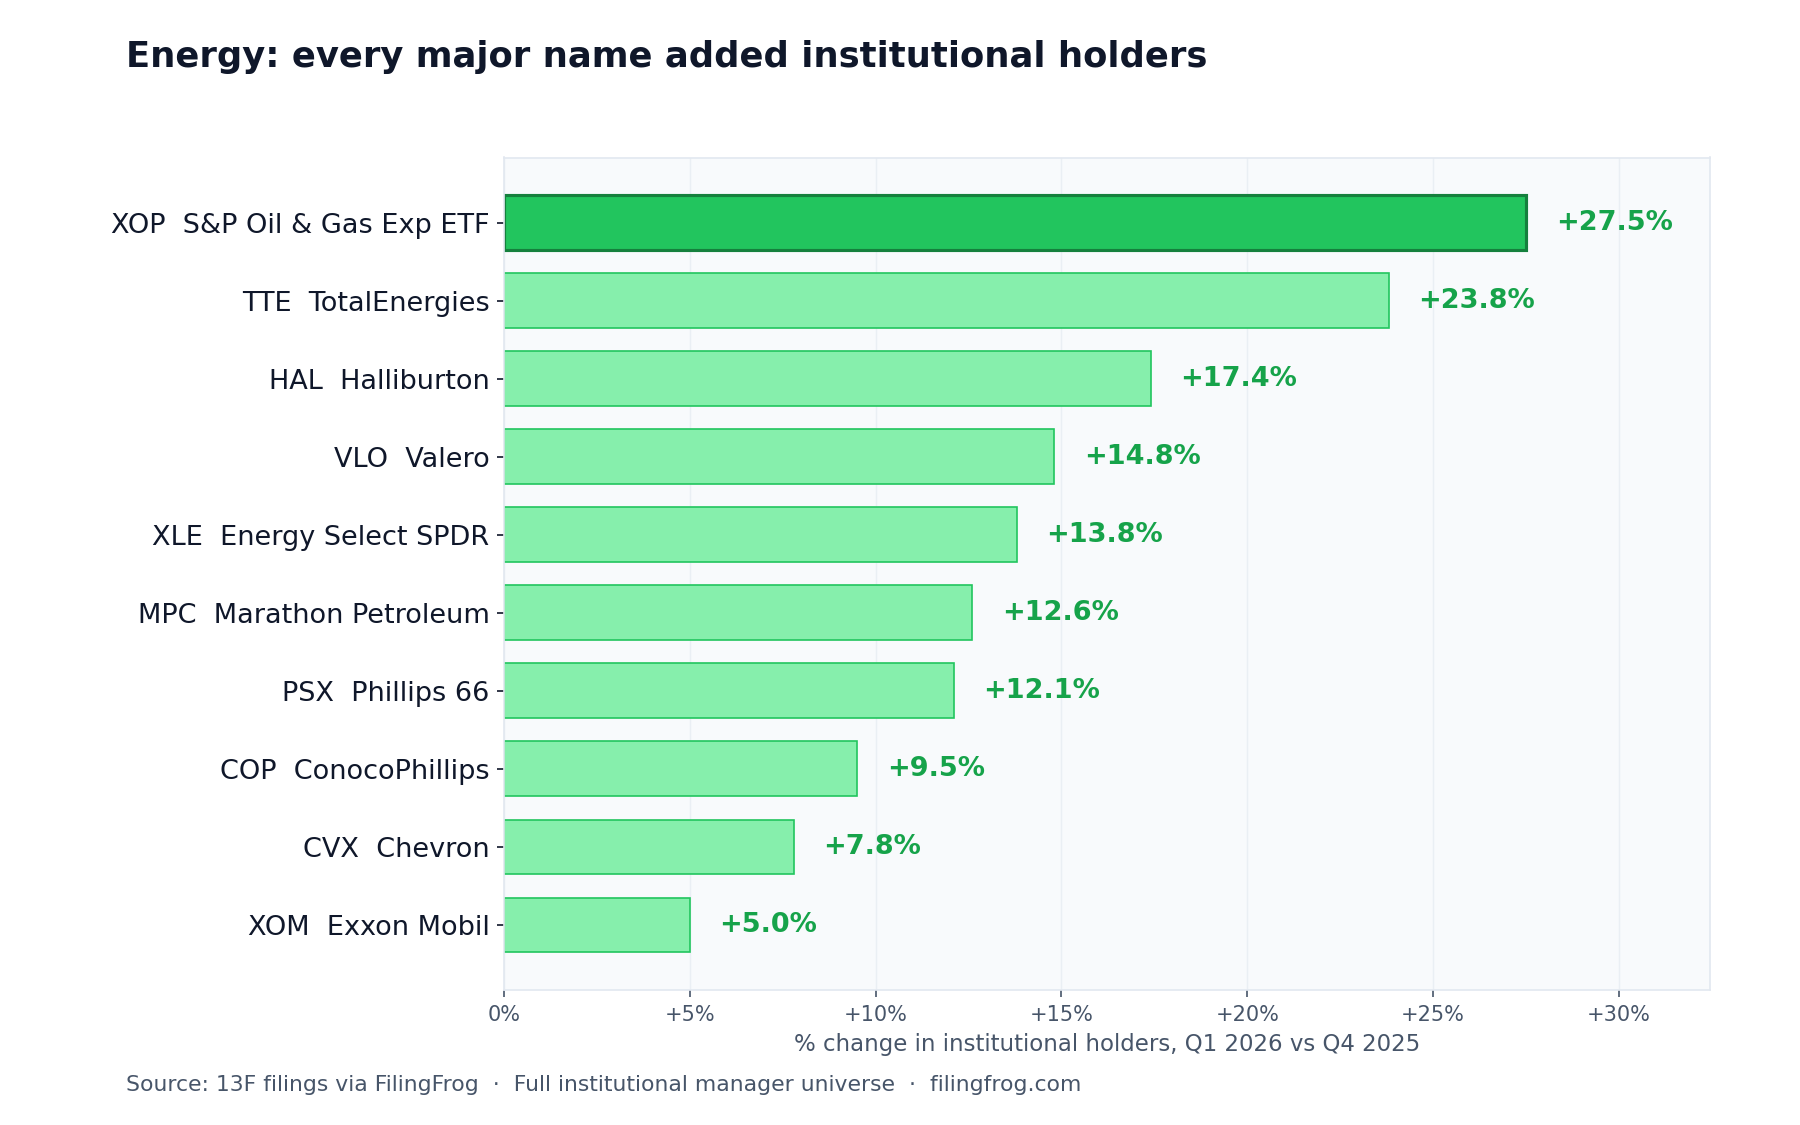
TotalEnergies (TTE) led the integrateds at +23.8%, with the refiner trio — Valero (VLO), Marathon Petroleum (MPC), Phillips 66 (PSX) — clustered around +12-15%. The broad Energy Select SPDR (XLE) gained +13.8% and SPDR Oil & Gas Exploration (XOP) +27.5%, which suggests some of the move was managers reaching for sector exposure rather than picking individual names. Halliburton (HAL) at +17.4% pulled oilfield services into the same trade.
The bifurcation is pronounced on this theme. The $100B+ managers added almost nothing — XOM and CVX each had zero net change at the top. Strip those 87 large managers out and the energy adds run roughly 50% larger across the board: TTE moves from +23.8% to +29.4%, VLO from +14.8% to +18.8%, XOM from +5.0% to +5.6%. The direction is the same in both views; the conviction reads much stronger when the structurally inert top is removed.
Semiconductor equipment vs designers: the split widened
The mid-cohort piece flagged equipment and materials names attracting holders while chip designers stayed flat. The full universe sharpens both halves of that pattern.
Equipment names: Lumentum (LITE) +44.8% — the largest move of any widely held name in the dataset — Applied Materials (AMAT) +11.5%, Lam Research (LRCX) +10.9%, KLA (KLAC) +8.1%, Micron (MU) +11.5%, Corning (GLW) +18.2%.
The standout late addition is SanDisk (SNDK) at +61.7% across the full universe — the most consensus add of any name, with adds in every manager-size bracket including the top. Neither early article flagged it. Memory storage joined the same AI-infrastructure thesis that had been concentrated in optics and wafer equipment.
Chip designers moved very little. Nvidia (NVDA) holders changed by -0.2%, AMD +1.0%, Broadcom (AVGO) -0.8%. The one designer that broke the pattern was Qualcomm (QCOM) at -8.7% — a single-name story tied to Apple modem share concerns, not part of the broader designer pattern. Marvell (MRVL) at +6.3% acted more like an equipment name.
Growth tech exits broadened beyond enterprise software
The early articles framed the selling as concentrated in enterprise SaaS. With the full universe in, it's broader — consumer growth, advertising, gaming, and developer tools all share the same shape. A rerating across high-multiple growth rather than a software-vertical story.
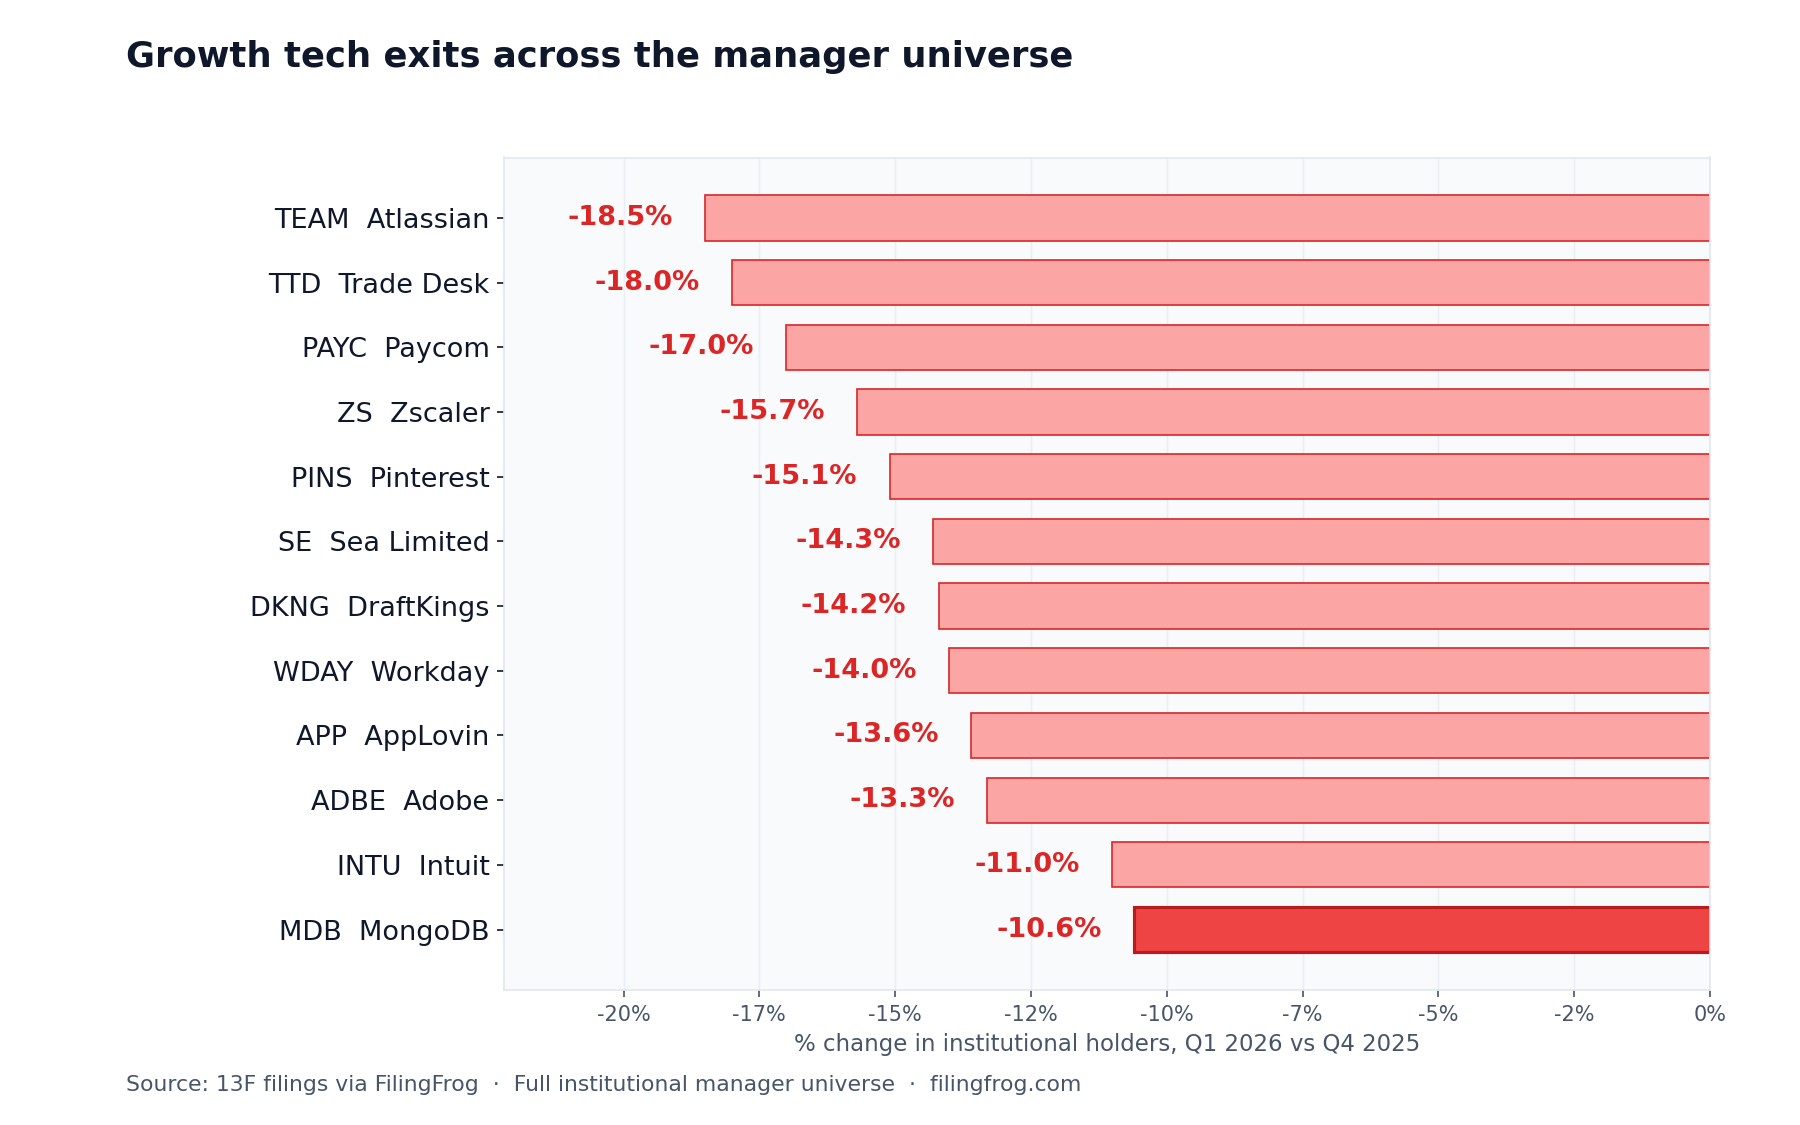
Atlassian (TEAM) led at -18.5%. The Trade Desk (TTD) at -18% extended the exit into ad tech. DraftKings (DKNG) and Sea Limited (SE) brought in consumer growth. MongoDB (MDB) and Zscaler (ZS) extended it to developer infrastructure and security. AppLovin (APP) -13.6%, Pinterest (PINS) -15.1%. The original Adobe-Intuit-Salesforce trio (ADBE -13.3%, INTU -11%, CRM -9.3%) is now part of a much longer list rather than an outlier group.
The bifurcation is pronounced here too. The largest managers were essentially untouched on these names; the exits compounded as you moved down the size scale. Strip the top 87 out and the magnitudes grow by roughly a third — TEAM moves from -18.5% to -24.2%, TTD from -18% to -22.7%, ADBE from -13.3% to -16.1%.
Mega-cap tech: holders barely moved
This is the place where the early framing needs a clear correction. The first article cited mega-cap tech as the largest weight reduction in its 193-manager sample. The full universe shows almost no actual movement: Microsoft (MSFT) -1.6%, Apple (AAPL) -0.2%, Alphabet (GOOGL) -1.2%, Meta (META) -1.4%, Amazon (AMZN) -1.3%, Nvidia (NVDA) -0.2%.
And unlike every other theme, the bifurcation says the same thing — these are flat in the active manager segment too. Aggregate dollar values fell sharply because Q1 prices fell sharply, but the institutional ownership base sat still. Weight change (portfolio share) moves any time prices move; position change measures whether managers actually bought or sold. On position, almost no one did anything with the mega-caps.
Bonds: the tilt was to cash and bills, not duration
The early front-end bond ETF call held. Vanguard 0-3M T-Bill (VBIL) +24%, iShares US Treasury (GOVT) +11.7%, iShares 0-3M Treasury (SGOV) +10%, SPDR 1-3M T-Bill (BIL) +6.3%. Longer duration went the other way: iShares 20+ Year Treasury (TLT) -4.4%, iShares Investment Grade Corporate (LQD) -3.1%. Yield-grab without taking rate risk.
Critical minerals and defense tech: the theme the early articles missed
This is the cleanest case of something only visible at full coverage. Neither early article flagged rare earths, copper miners, or small-cap defense and drone names. Several of these names show the highest holder growth in the dataset.
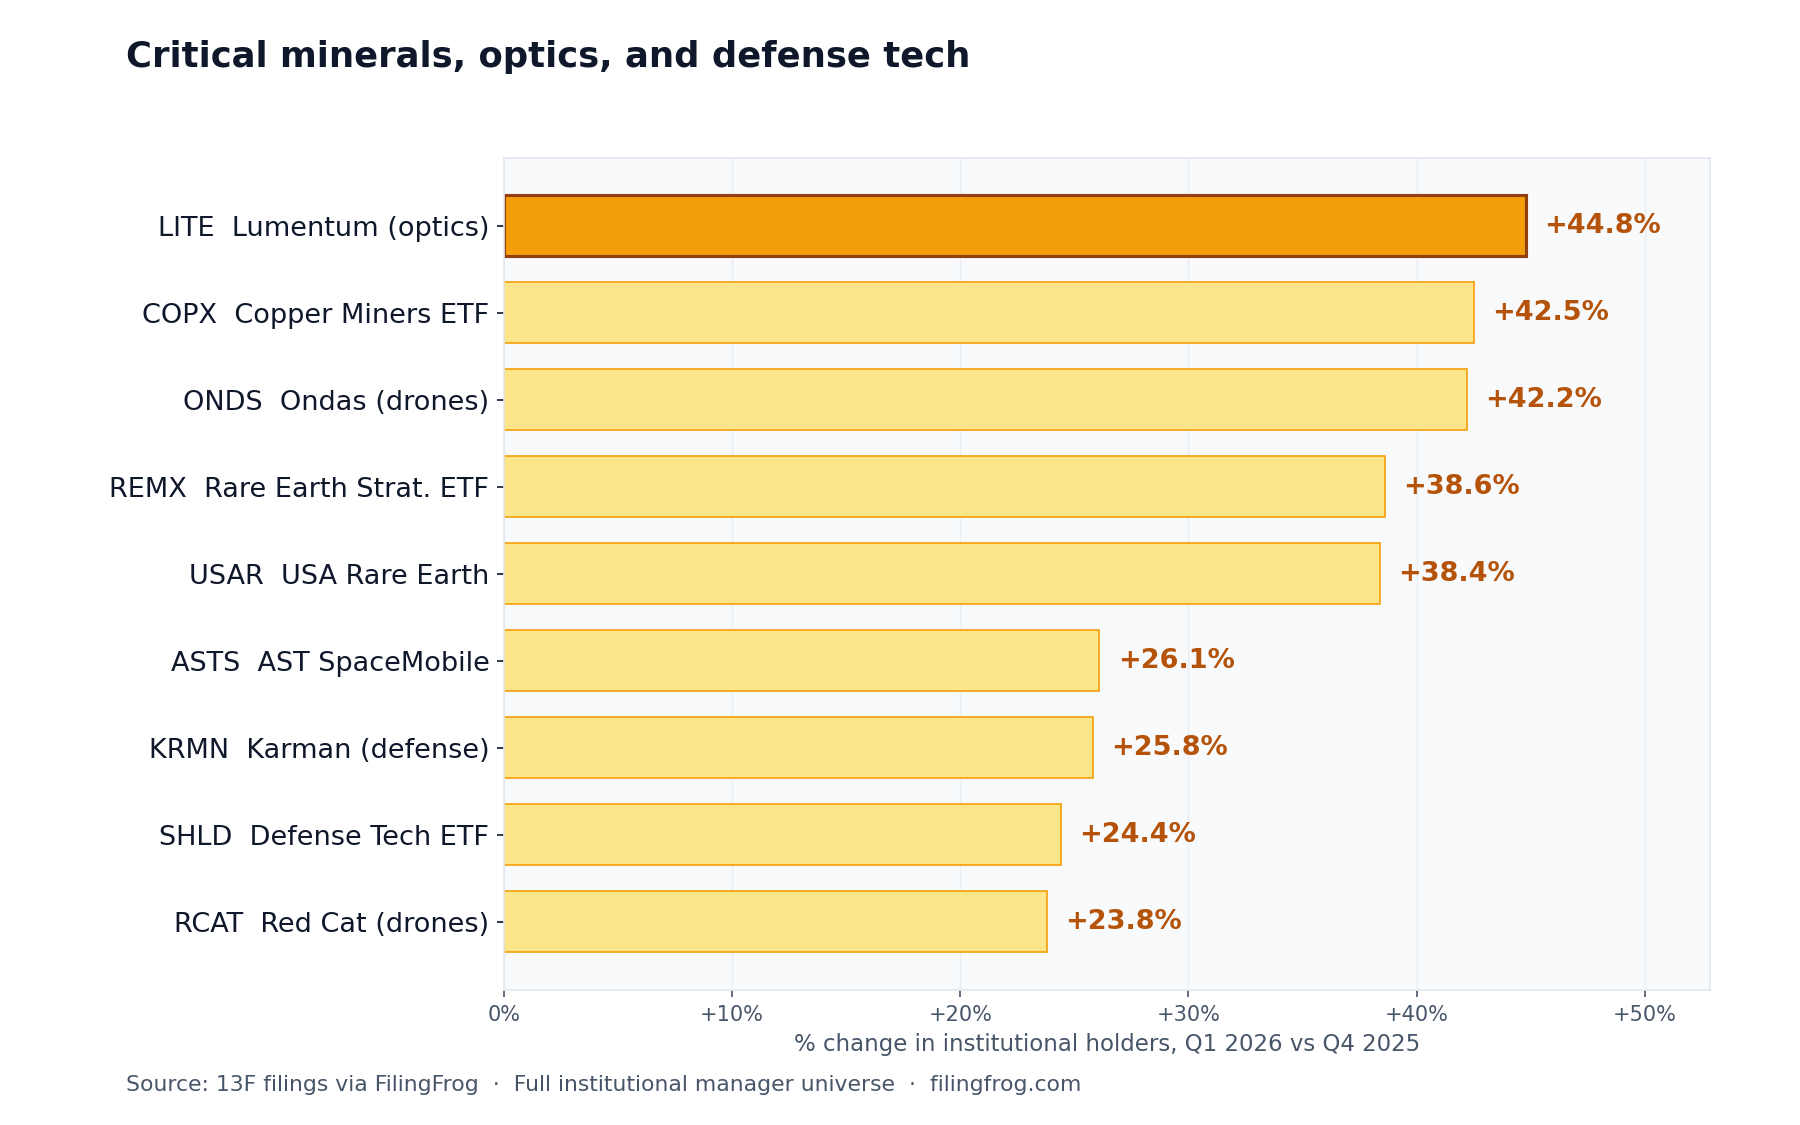
Global X Copper Miners (COPX) +42.5%, Ondas Holdings (ONDS) +42.2%, VanEck Rare Earth & Strategic Metals (REMX) +38.6%, USA Rare Earth (USAR) +38.4%, Karman (KRMN) +25.8%, Red Cat (RCAT) +23.8%, AST SpaceMobile (ASTS) +26.1%, Global X Defense Tech ETF (SHLD) +24.4%.
These are smaller-cap names with modest prior holder bases, so the percentage moves don't translate to enormous absolute counts. But the magnitudes are consistent across a coherent group — rare earths, copper, drone hardware, defense ETFs, small-cap defense suppliers. The narrative thread is supply-chain reshoring and trade-policy hedging, which were the dominant macro topics of the quarter. Worth noting on this theme specifically: even the largest managers added in non-trivial numbers (SHLD +23% among $100B+ managers), which is unusual.
Country ETFs: a parallel signal that emerged late
iShares MSCI South Korea (EWY) +28.1%, iShares Latin America 40 (ILF) +28.9%, iShares MSCI Brazil (EWZ) +25.9%. Broad ex-US ETFs barely moved — VEA +2.9%, EFA +0.3% — and iShares China Large-Cap (FXI) lost 9.1%. Managers picked specific countries rather than reaching for diversified international exposure, with a mix consistent with the same supply-chain framing as the critical-minerals theme.
Deal closures account for the largest holder collapses
Several near-total collapses are mechanical, not active selling. CyberArk Software (CYBR) went 648 → 3 holders on the Palo Alto Networks acquisition close. Comerica (CMA) 548 → 4 on Fifth Third. Dayforce (DAY) followed a similar pattern. The released capital is a likely source of funding for the new adds visible above; the same managers who held these names for the arb spread are showing up as new holders in energy, critical minerals, and bills.
Where the bifurcation matters
The active rotation themes look meaningfully stronger when the largest 87 managers — who together hold roughly 71% of total reported AUM but rarely move on tactical themes — are set aside. The table below shows the full-universe holder change against the same measure for the 7,821 managers under $5 billion in AUM, where the active positioning decisions actually live.
| Ticker | Name | Full universe | Sub-$5B managers | Read |
|---|---|---|---|---|
| TTE | TotalEnergies | +23.8% | +29.4% | Active conviction stronger |
| VLO | Valero | +14.8% | +18.8% | Active conviction stronger |
| SNDK | SanDisk | +61.7% | +89.4% | Consensus add even sharper among active |
| LITE | Lumentum | +44.8% | +52.5% | Active conviction stronger |
| TEAM | Atlassian | -18.5% | -24.2% | Active exit deeper |
| ADBE | Adobe | -13.3% | -16.1% | Active exit deeper |
| WDAY | Workday | -14.0% | -18.5% | Active exit deeper |
| MSFT | Microsoft | -1.6% | -1.8% | Flat in both — no active rotation |
| NVDA | Nvidia | -0.2% | -0.3% | Flat in both — no active rotation |
| USAR | USA Rare Earth | +38.4% | +37.1% | Broad-based: even large managers participated |
The mega-cap rows make the cleanest point. On those names the two columns match — both are flat. That means no one was rotating, period. On every active-rotation theme, the sub-$5B column is meaningfully larger; the full-universe number compresses the signal by including managers who don't move.
Where the early signals stand, in one read
- Energy rotation — confirmed; every major segment added holders
- Semiconductor equipment vs designer split — confirmed; SanDisk emerged as the largest broad-based add
- Growth tech exits — confirmed and broadened beyond enterprise SaaS
- Mega-cap tech weight loss — corrected; holders barely moved, prices did the work
- Front-end bond ETF tilt — confirmed; longer duration was actually being trimmed
- Index ETF abandonment — overstated; SPY/IVV flat to slightly down, RSP and SCHD added
- Critical minerals and small-cap defense tech — entirely new theme, broadly held
- Country-specific international rotation — entirely new theme
- Defense and infrastructure adds — confirmed
Notes
Data covers 13F filings for Q1 2026 (period ending March 31, 2026) from 8,572 institutional managers, compared against the same managers' Q4 2025 holdings. Total reported equity AUM: $63.4 trillion. The "sub-$5B" cohort in the comparison table refers to the 7,821 managers in the $1-5B and sub-$1B AUM brackets combined, holding approximately $5 trillion. Holder collapses on names like CyberArk, Comerica, and Dayforce reflect closed acquisitions, not active selling. Full ownership history for any individual security is available in the ownership changes section. Part 1 of this series: First Filings In. Part 2: Update at 15% Coverage.