How the Nuclear-Power Trade Spread Across ETF Holdings (N-PORT, 2026)
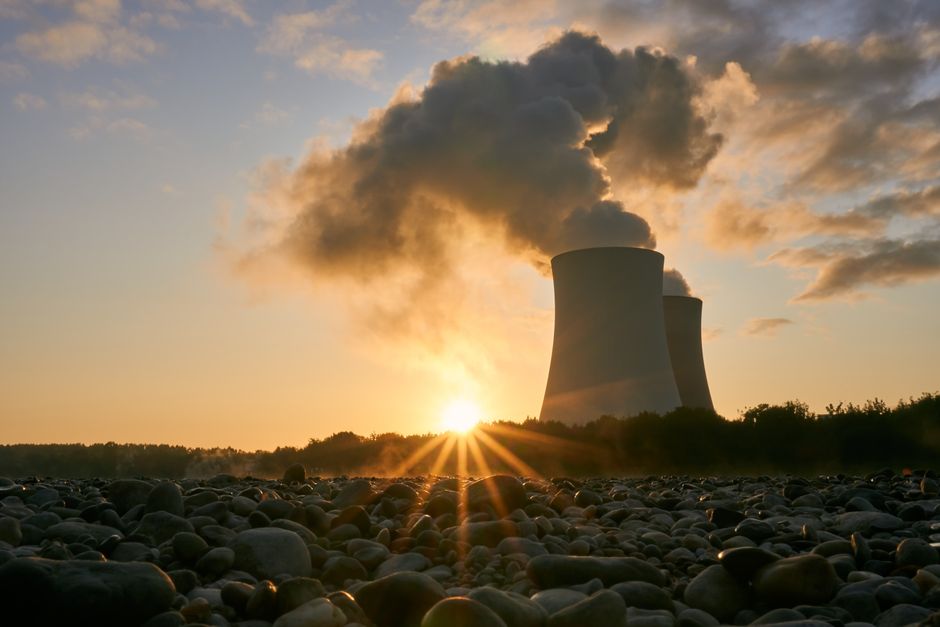
When Meta went looking for electricity to run its Prometheus AI supercluster, it did not sign with a wind farm. In January 2026 the company announced agreements for up to 6.6 gigawatts of nuclear power — from Oklo (OKLO), Vistra (VST) and privately held TerraPower — to feed data centers that run around the clock. Similar deals from Amazon, Microsoft and Google have pulled a once-quiet corner of the energy market into one of the more crowded trades around.
Monthly fund holding disclosures (SEC Form N-PORT) show where that enthusiasm has landed. The answer, increasingly, is everywhere.
A category that barely existed two years ago
In early 2024, an investor who wanted the nuclear theme in a single ticker had a handful of uranium-miner funds to choose from. Today there are eleven US ETFs that put at least a quarter of their portfolio into nuclear power, uranium, and the reactor supply chain — holding about $17.3 billion between them. Two years ago the same screen returned five funds and roughly $5 billion.
Most of the newcomers arrived in the past year, and their names read like a map of the moment: the Tortoise Nuclear Renaissance ETF, the Range Nuclear Renaissance Index ETF, the First Trust Bloomberg Nuclear Power ETF, the Themes Uranium & Nuclear ETF, and analyst Dan Ives' Defiance AI & Power Infrastructure ETF.
The money kept coming
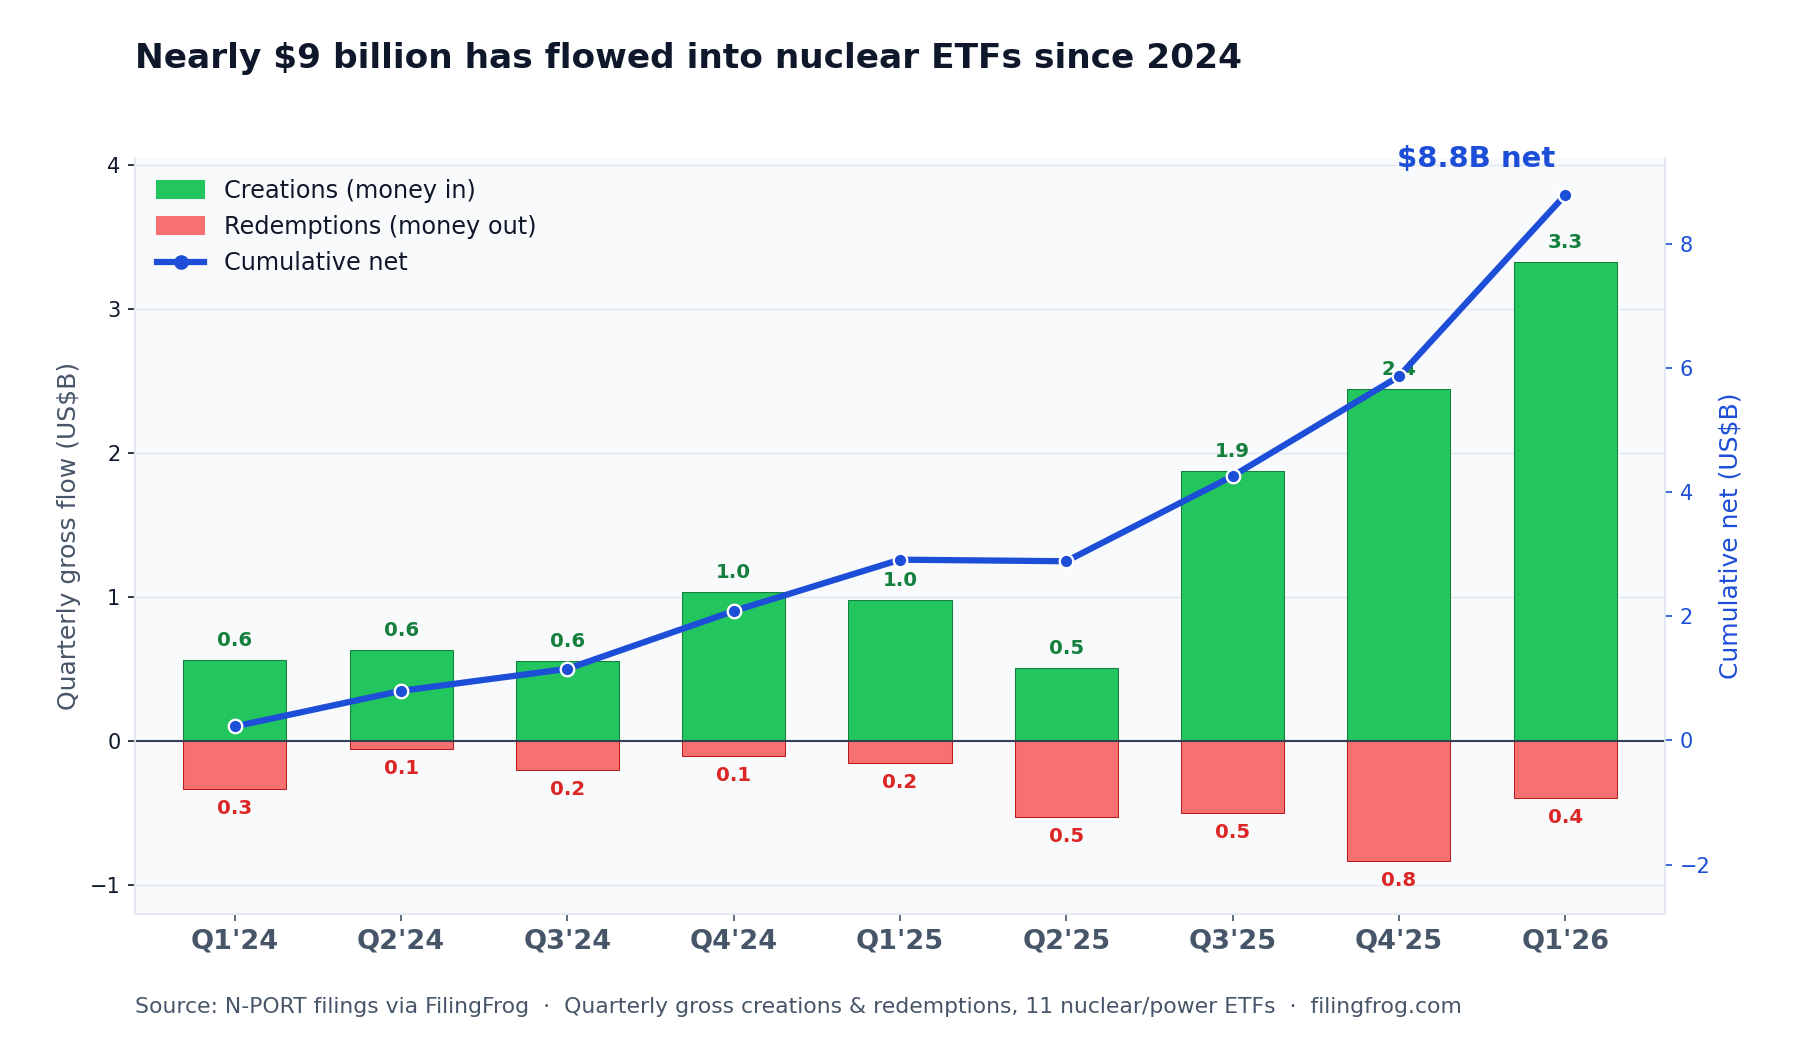
Rising share prices explain part of the category's growth, but new money did more of the work. Since the start of 2024 the eleven funds have drawn about $13 billion of gross share creations against roughly $4 billion of redemptions — a net inflow of nearly $9 billion, more than the whole category was worth two years ago.
The pace is the tell. Net inflows ran a few hundred million dollars a quarter through 2024, and stalled only once — in the spring of 2025, when a uranium selloff drew about half a billion dollars of redemptions that a nearly equal wave of buying just offset. From there they climbed: net inflows of roughly $1.4 billion in the third quarter of 2025, $1.6 billion in the fourth, and $2.9 billion in the first quarter of 2026, the months in which Meta, Amazon and others were signing their nuclear deals.
The money sits in three funds
That flood of cash is not spread evenly. Three of the oldest funds — the Global X Uranium ETF (URA), the VanEck Uranium & Nuclear ETF (NLR) and the Sprott Uranium Miners ETF (URNM) — hold about $14.5 billion, or 84% of the category. The other eight split what is left, and several manage only a few million dollars.
Global X Uranium alone has grown from $2.9 billion in early 2024 to $7.8 billion, most of that in the past year. Nearly a quarter of it sits in a single stock, Cameco (CCJ).
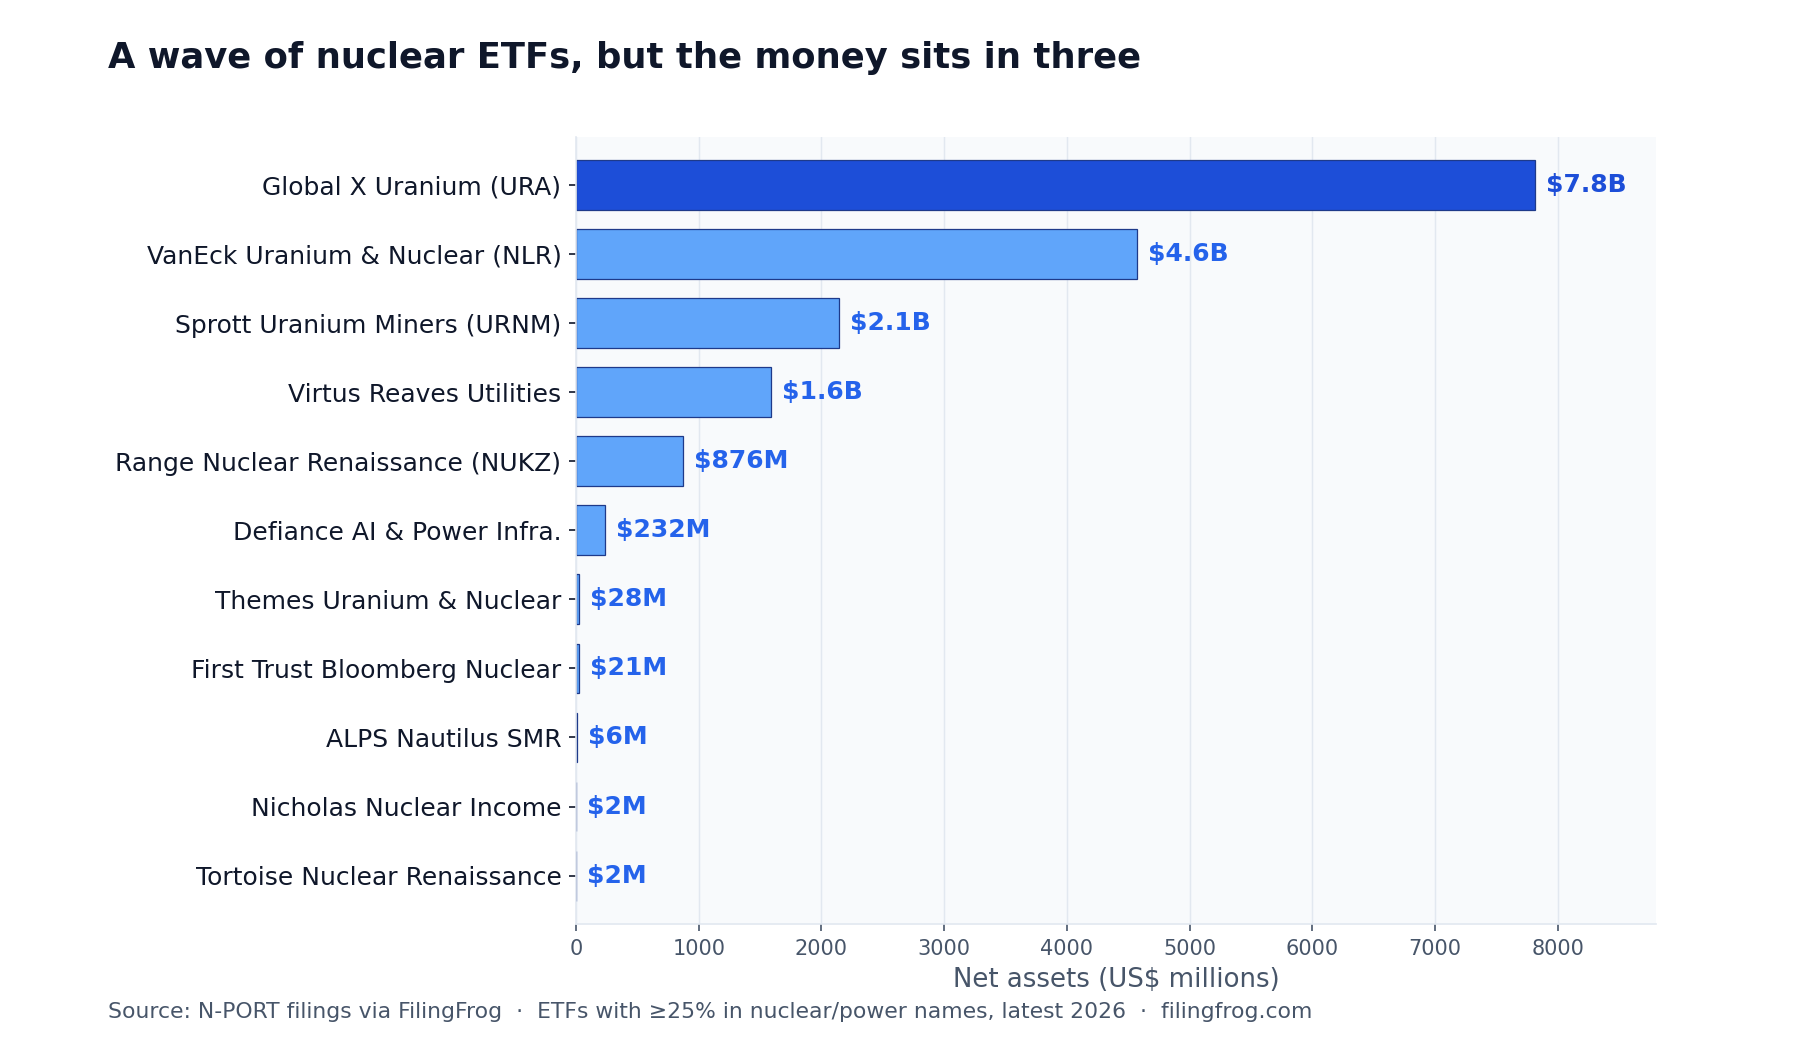
Ranked by how much of each portfolio goes to nuclear and power names:
- Global X Uranium (URA) — 55.0%
- VanEck Uranium & Nuclear (NLR) — 52.5%
- Tortoise Nuclear Renaissance — 49.5%
- Sprott Uranium Miners (URNM) — 47.5%
- ALPS Nautilus SMR Nuclear & Technology — 45.5%
- Virtus Reaves Utilities — 36.5%
- Nicholas Nuclear Income — 32.1%
- Range Nuclear Renaissance (NUKZ) — 30.9%
- First Trust Bloomberg Nuclear Power — 28.1%
- Defiance AI & Power Infrastructure — 27.1%
- Themes Uranium & Nuclear — 26.7%
The trade did not stay in the nuclear funds
The more telling pattern is how far these stocks have traveled. Constellation Energy (CEG), the largest US nuclear operator, now appears in about 330 US ETFs, up from 220 two years ago. Vistra is in roughly 307, up from 197.
The reactor developers moved faster still. Oklo went from a single fund to 95; Talen Energy (TLN) from one to 144; GE Vernova (GEV) from 62 to 394. Some of that reflects new listings — GE Vernova was spun out of General Electric in April 2024, Oklo and NANO Nuclear Energy (NNE) went public that year, and Talen had only just relisted after bankruptcy. But Constellation and Vistra were already public and widely held, and their fund counts still climbed by roughly half.
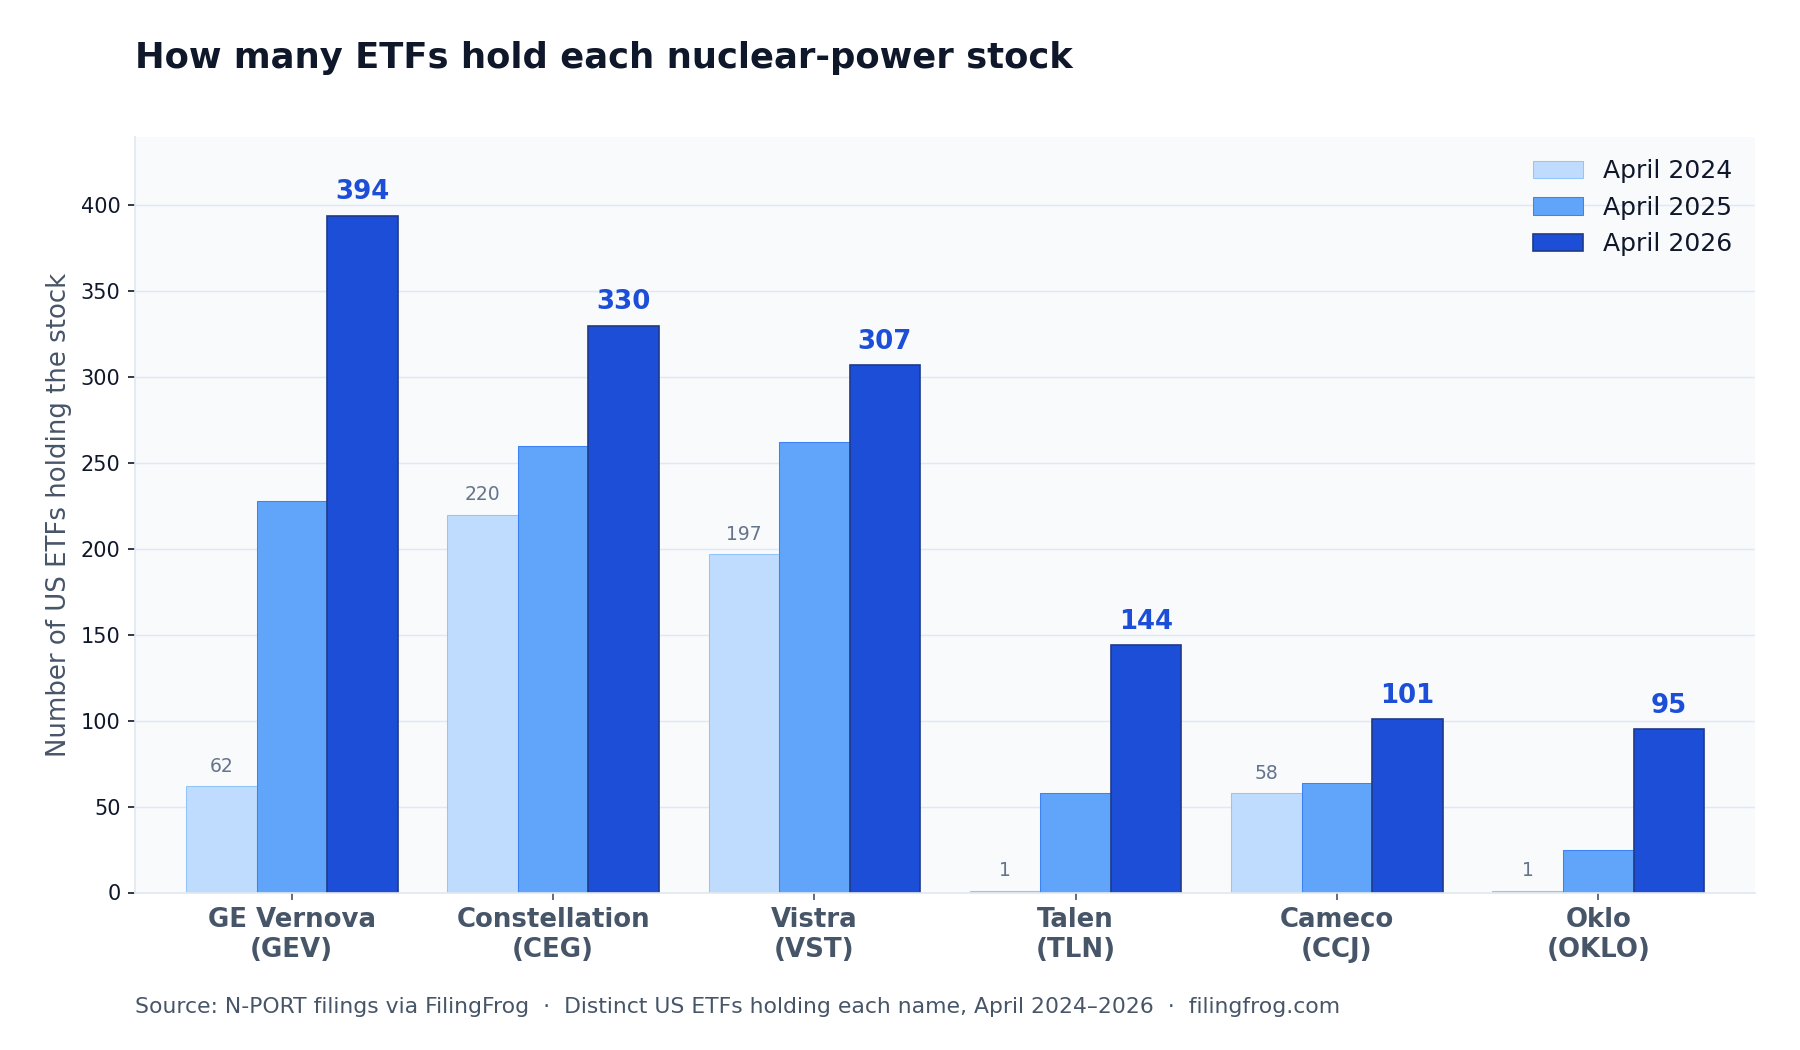
It reached the utility funds, too
The clearest sign the theme has gone mainstream is where it turns up by accident. The Utilities Select Sector SPDR (XLU), the $24 billion fund most investors treat as a proxy for steady dividend payers, now holds about 11.7% across Constellation, Vistra and NRG Energy (NRG). Constellation is its fourth-largest position — ahead of century-old regulated utilities like American Electric Power and Sempra.
The pattern repeats in the Fidelity MSCI Utilities Index ETF and the iShares U.S. Utilities ETF, each carrying roughly 12% in the same handful of power producers. A market that reprices Constellation and Vistra as AI-infrastructure plays pulls every market-cap-weighted utility fund along with it.
The speculative end travels with the blue chips
The same funds that hold the established operators increasingly hold the earlier-stage names beside them: reactor designers NuScale Power (SMR) and Oklo, enrichment company Centrus Energy (LEU), and reactor-parts maker BWX Technologies (BWXT), which now appears in 184 ETFs. Centrus is worth watching for a specific reason: the advanced reactors these deals depend on run on a fuel called HALEU, produced almost entirely in Russia until recently, and Centrus is one of the few Western suppliers building capacity for it.
For anyone holding a broad growth or utility fund, it may be worth knowing how much of that exposure now rides on plants that will not deliver power until 2030 or later.
Explore Fund HoldingsNotes
Holdings are drawn from N-PORT filings, using each fund's most recent report within the trailing six months (report dates from January to April 2026). The nuclear-and-power basket covers Constellation, Vistra, Talen, NRG, Oklo, NuScale, NANO Nuclear, Centrus, GE Vernova, Cameco, BWX Technologies and the major uranium miners; GE Vernova and NRG are diversified power names rather than pure nuclear. Fund counts reflect distinct ETF series holding each stock, and the "dedicated" category is defined as funds with at least 25% of assets in the basket. Flow figures are share creations and redemptions as reported in the same filings, summed across the eleven dedicated funds; the cumulative line is their running net. Individual fund holdings and history are available in the fund section, and screens like this one can be built in the screener.