The Quiet Boom in Option Income ETFs

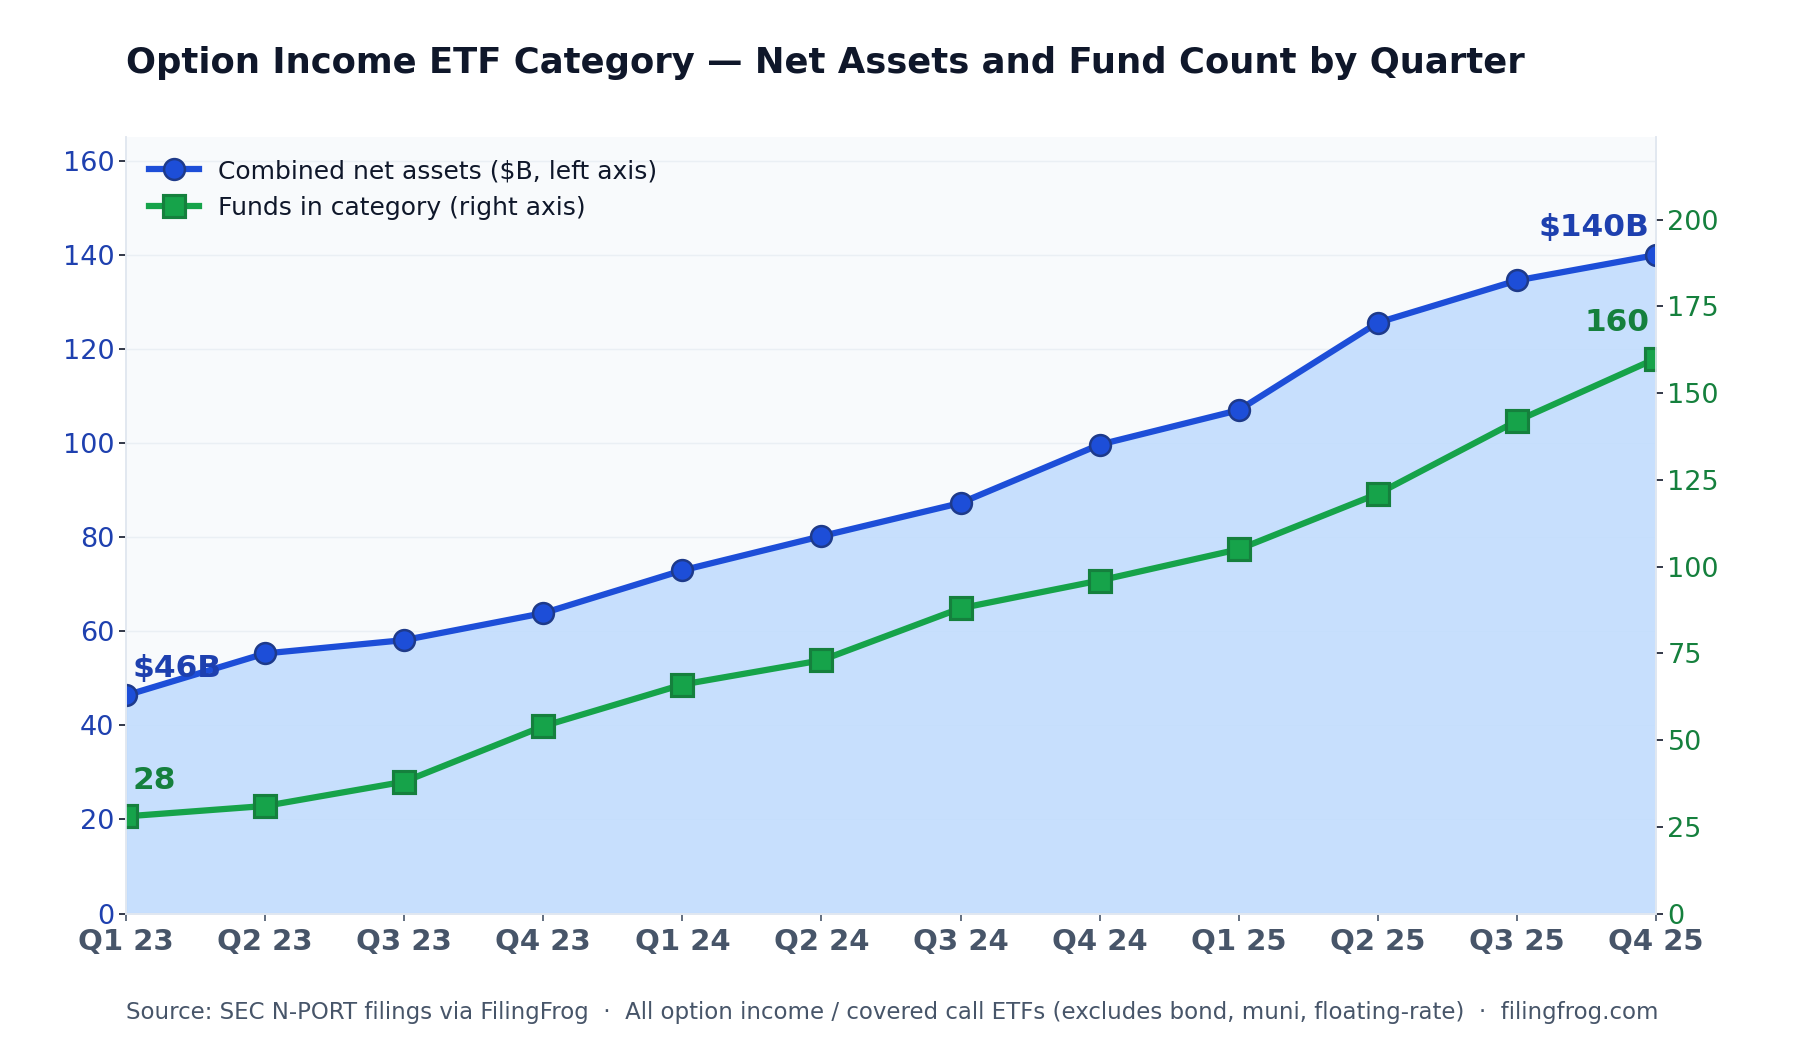
Five years ago a "covered call ETF" meant one of three Global X funds and a small JPMorgan strategy that had not yet crossed $20 billion. Today there are roughly 160, the category sits at about $140 billion in combined net assets, and a new fund seems to launch every quarter — Goldman, ProShares, BlackRock, Roundhill, REX, NEOS, Amplify, T. Rowe Price, State Street, and the YieldMax family of single-stock variants are all in the mix.
Reading fund disclosures alongside institutional ownership data shows the same thing from two angles: the products are growing and proliferating, and the wealth-management complex is the one putting clients into them.
From two funds to a category
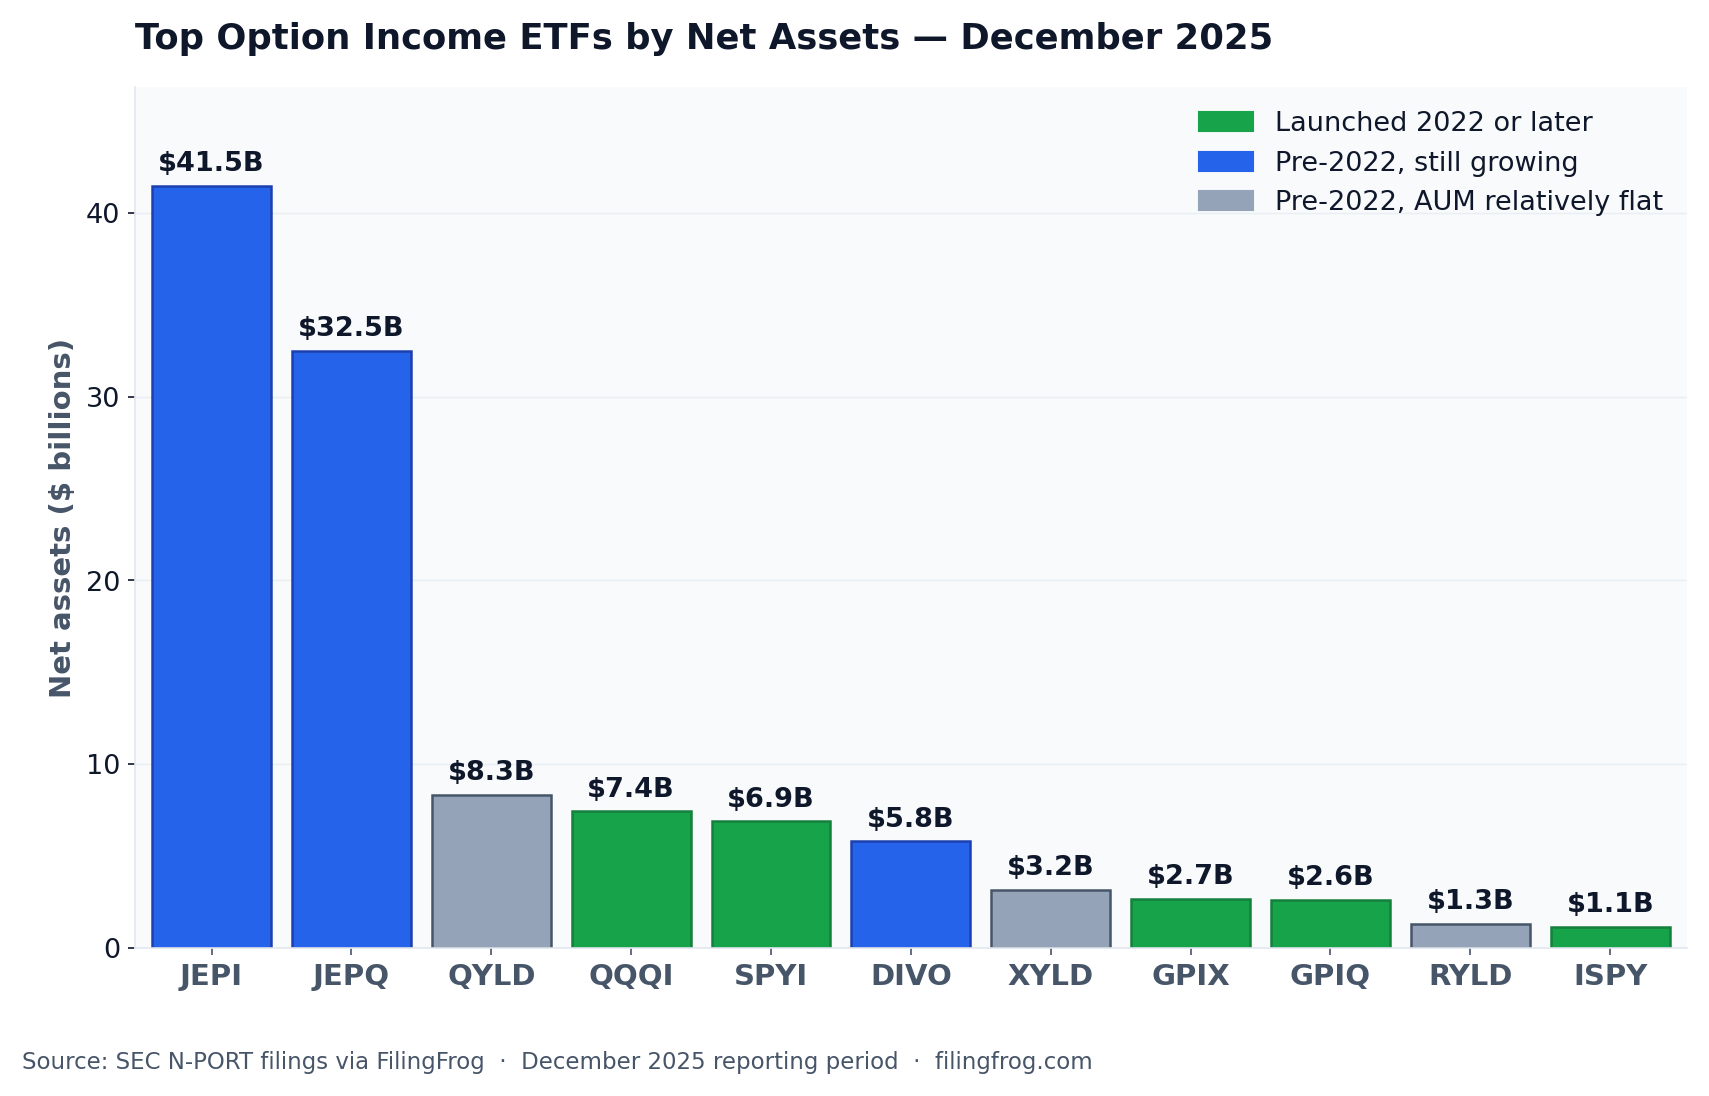
The largest products are still JPMorgan Equity Premium Income (JEPI) at $41.5 billion and JPMorgan Nasdaq Equity Premium Income (JEPQ) at $32.5 billion. JEPI roughly 2.4x'd over three years; JEPQ went from about $1 billion at the end of 2022 to over $32 billion at the end of 2025.
What is more interesting than either of those numbers is what filled in below them. A handful of funds that did not exist or were rounding errors three years ago now manage real money:
- NEOS S&P 500 High Income (SPYI) — $6.9B, from a $4M launch in early 2023
- NEOS Nasdaq-100 High Income (QQQI) — $7.4B, launched February 2024
- Goldman Sachs S&P 500 Premium Income (GPIX) — $2.7B, launched late 2023
- Goldman Sachs Nasdaq-100 Premium Income (GPIQ) — $2.6B, launched late 2023
- ProShares S&P 500 High Income (ISPY) — $1.1B, launched early 2024
The older Global X covered-call lineup tells a different story. QYLD, XYLD, and RYLD together held about $10.6 billion at the end of 2022 and roughly $12.8 billion at the end of 2025 — flows in, but the asset base has not really gone anywhere. Amplify CWP Enhanced Dividend Income (DIVO) sits between the two camps at $5.8 billion, having a bit more than doubled.
And below those eleven, a long tail. There are now Innovator buffer-and-premium-income variants for every month of the year, Roundhill 0DTE covered call ETFs on the S&P 500 / Nasdaq / Russell / Bitcoin / Ether, State Street Premium Income ETFs covering each S&P 500 sector individually, NEOS variants on real estate / gold / EAFE / MLPs, T. Rowe Price's Capital Appreciation Premium Income ETF, and a Bitwise / Grayscale / Amplify trio competing on Bitcoin and Ethereum option income. Most of these are small individually, but they add up to a category that has roughly 5x'd the number of products in three years.
How the strategy actually generates the yield
The mechanics are the same across the lineup, with variations. The fund holds a basket of stocks — JEPI uses an actively-selected low-volatility S&P 500 sleeve, QYLD owns the Nasdaq-100 outright, SPYI tracks the S&P 500 — and then sells call options against those holdings each month. Buyers of those calls pay a premium up front. The fund collects that premium and distributes it to shareholders.
The premium is the income. The trade-off is what gets given away to collect it: if the index rallies above the strike of the calls that were sold, the fund's gains are capped, and the buyer of the call captures the rest. JEPI and JEPQ try to soften this by selling calls through equity-linked notes that are out of the money, keeping some upside. QYLD sells at-the-money calls on the entire portfolio, which produces a higher distribution yield and almost no participation in a strong rally. The Roundhill 0DTE funds sell calls that expire the same day they are written, harvesting very short-dated premium continuously.
None of the funds are leveraged. The yield does not come from credit risk or duration — it comes from selling volatility. When implied volatility is elevated, premiums are richer and distributions tend to be larger. When markets are quiet, premiums shrink.
Who is doing the buying
The names at the top of JEPI's institutional holder list are the wealth-management platforms — Morgan Stanley ($2.7B), Bank of America ($1.8B), Wells Fargo ($962M), Envestnet ($566M), Raymond James ($464M), Royal Bank of Canada, UBS, JPMorgan's own private bank, LPL, Cetera, Edward Jones, Northwestern Mutual, Stifel.
That is not what a hedge fund position list looks like. It is what a retail product distribution list looks like.
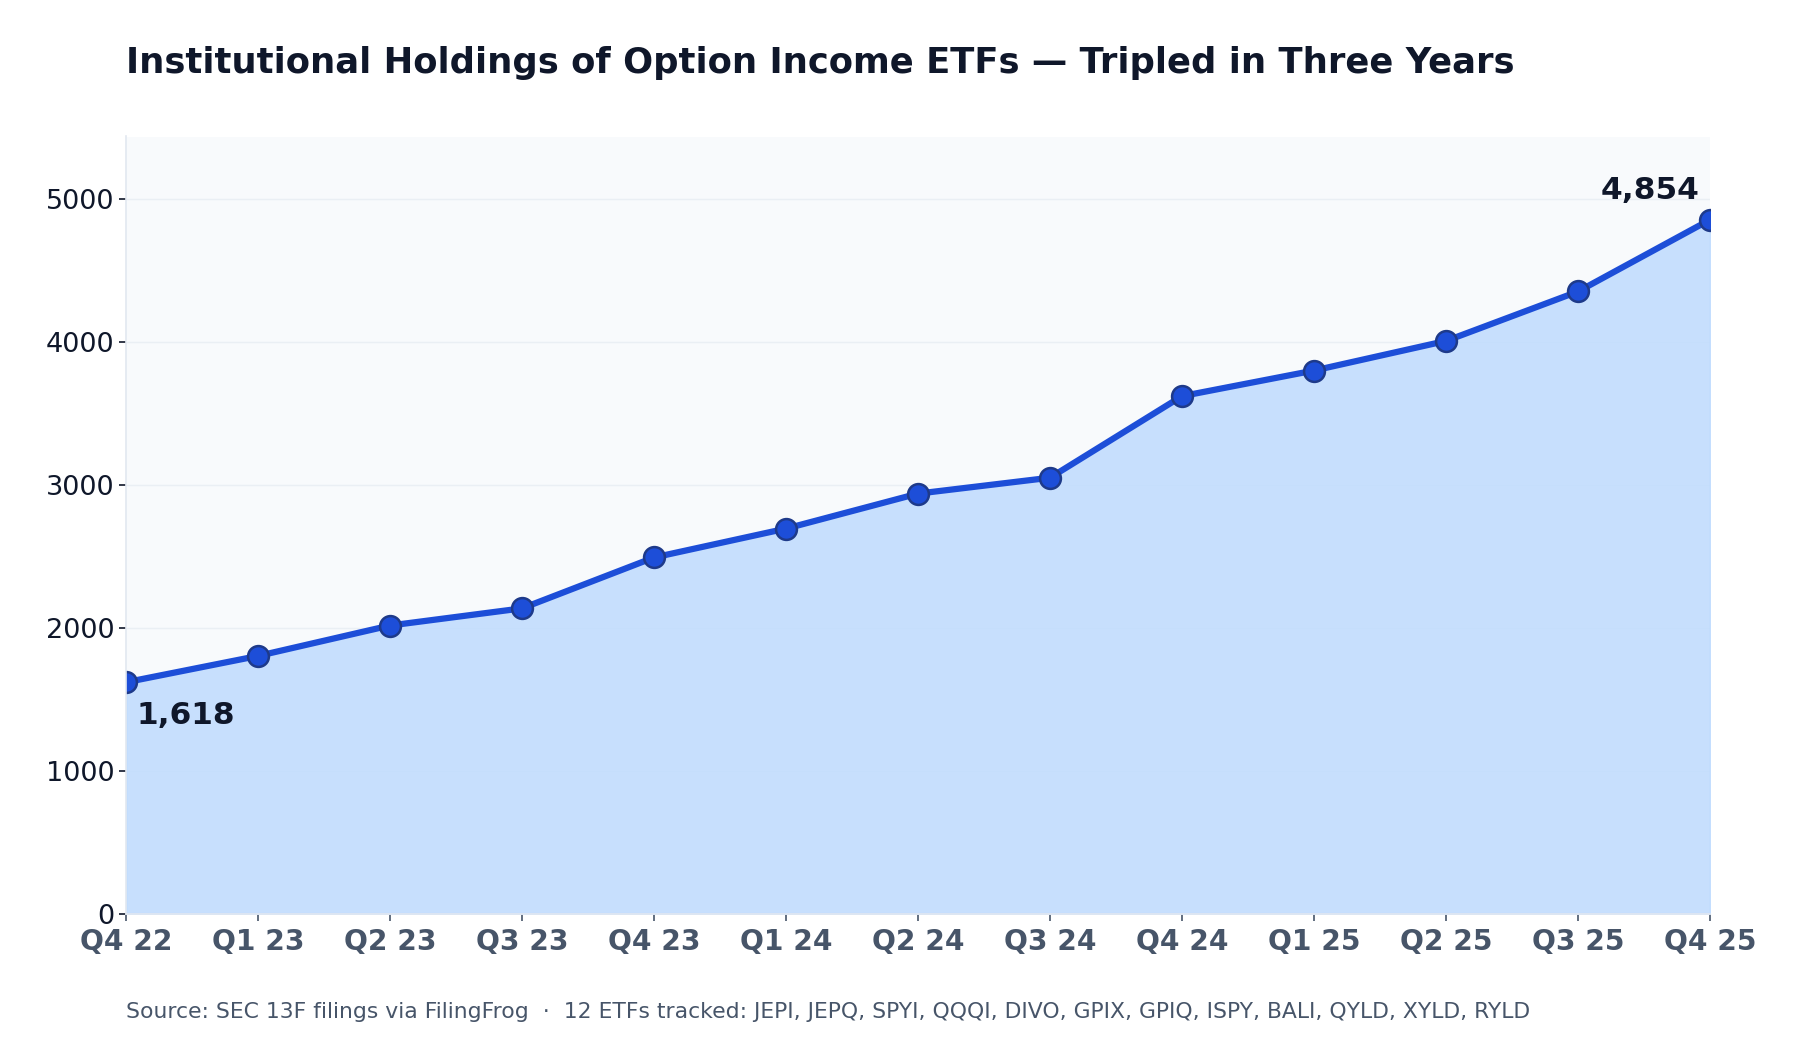
Across the dozen largest option income ETFs, the count of distinct (manager, ETF) holding relationships rose from about 1,600 at the end of 2022 to roughly 4,900 at the end of 2025 — close to a 3x increase. The number of large institutional managers ($100B+ AUM) reporting positions in JEPI alone passed thirty.
The bulk of the dollar value sits in the very largest tier of advisors — but the long tail of mid-size RIAs is where most of the new holder counts have come from. JEPI alone has 825 holders in the $100M-$1B AUM bucket. That is a lot of advisors deciding the strategy fits a client account.
The single-stock cousin
The same idea pushed to its logical extreme is the YieldMax family — option income ETFs that sell calls (or use synthetic positions) on a single underlying stock. The largest are now sizable in their own right: YieldMax NVDA (NVDY) at $1.55B, MSTR (MSTY) at $1.28B, the Ultra fund at $1.20B, and TSLA (TSLY) at $1.05B. The full lineup runs to more than thirty single-name products covering AAPL, AMZN, GOOGL, COIN, PLTR, HOOD, and a long list of others, and Bitwise, Grayscale, Defiance, and Tuttle Capital have all launched competing single-name option income variants in the past year.
Distribution yields advertised on these products often exceed 50% annualized. They are also funds where the underlying is a single volatile equity, the call premiums sold are large because that volatility is large, and the realized return — total return, not just income — depends entirely on what the underlying does and how the option overlay is rolled. Some of the YieldMax funds have lost a substantial portion of their NAV since launch even while paying double-digit monthly distributions.
What the data does not capture
Several things sit outside what the filings show.
The first is total return. Net assets and holder counts say nothing about whether shareholders have made money. JEPI has been close to flat in price terms over its life while paying a roughly 7-8% distribution yield; QYLD's NAV has eroded steadily for a decade while it paid out a roughly 12% distribution. Whether that is acceptable depends on the buyer's framing — for someone using the fund for cash flow, NAV erosion may be tolerable; for someone using it as an equity substitute, less so.
The second is tax treatment. A meaningful portion of distributions from these funds has historically been classified as ordinary income or return of capital, not qualified dividends. In a taxable account, the after-tax yield can look very different from the headline yield. The newer NEOS funds market their use of Section 1256 contract treatment as a tax advantage; the older funds generally do not.
The third is regime dependence. Most of these products were launched in or after the post-2020 environment of elevated implied volatility and a generally bid market. They have not yet been tested through a sustained drawdown with collapsing realized volatility — the conditions under which call-writing strategies tend to disappoint relative to the index they sit on top of.
Explore Fund HoldingsNotes
Net asset figures are drawn from N-PORT filings for the December 2025 reporting period (or the closest fiscal-period filing available) for each fund listed. The 160-fund category count covers all ETFs with names containing "Covered Call," "Option Income," "Premium Income," "Buy-Write," "Enhanced Dividend Income," or "0DTE Covered Call" — bond, municipal, and floating-rate funds are excluded. Quarterly combined-AUM figures use each fund's most recent net-assets reading within six months of each quarter end, since funds report on different fiscal-year cadences. Institutional holder data is drawn from 13F filings through Q4 2025 — Q1 2026 13F data was excluded from headline numbers because the May 15 filing deadline has not yet passed and the dataset is incomplete. The 12-fund count for institutional holdings covers JEPI, JEPQ, SPYI, QQQI, DIVO, GPIX, GPIQ, ISPY, BALI, QYLD, XYLD, and RYLD. Individual fund history and holdings are available through the fund section; cross-fund views for each ticker are linked above.