A Handful of Credit Funds Got Less Liquid Last Quarter — Without Buying a Thing

Between November and February, a handful of credit funds got less liquid — meaning a bigger slice of each portfolio shifted into holdings that are hard to value and hard to sell quickly. In most of these funds, the manager didn't buy anything new to make that happen. Some were holding the same loans they had three months earlier, but those loans got harder to price. Others saw investors pull money out of the easy-to-sell parts of the portfolio, leaving the illiquid parts as a bigger share of what was left.
Funds report each holding by how easy it is to price: liquid stocks and bonds in the easiest bucket, harder-to-price paper in the middle, and the hardest paper — mostly private loans and thinly-traded structured credit — in the bottom bucket. When that bottom bucket grows as a share of a fund, the fund has gotten less liquid. Across roughly 2,600 credit-and-bond funds reporting on the same cycle, only seven moved that share by more than three percentage points. The interesting question is what drove the move.
Three different stories, one shared outcome
For each of the seven funds, the hard-to-sell holdings in February can be lined up against the holdings the fund reported in November. Three things can grow that bucket: positions the fund didn't own before (genuine new buying), the same positions it already had but now classified as harder to sell, and positions that were already in the hardest bucket the previous period. The split tells a different story for each fund.
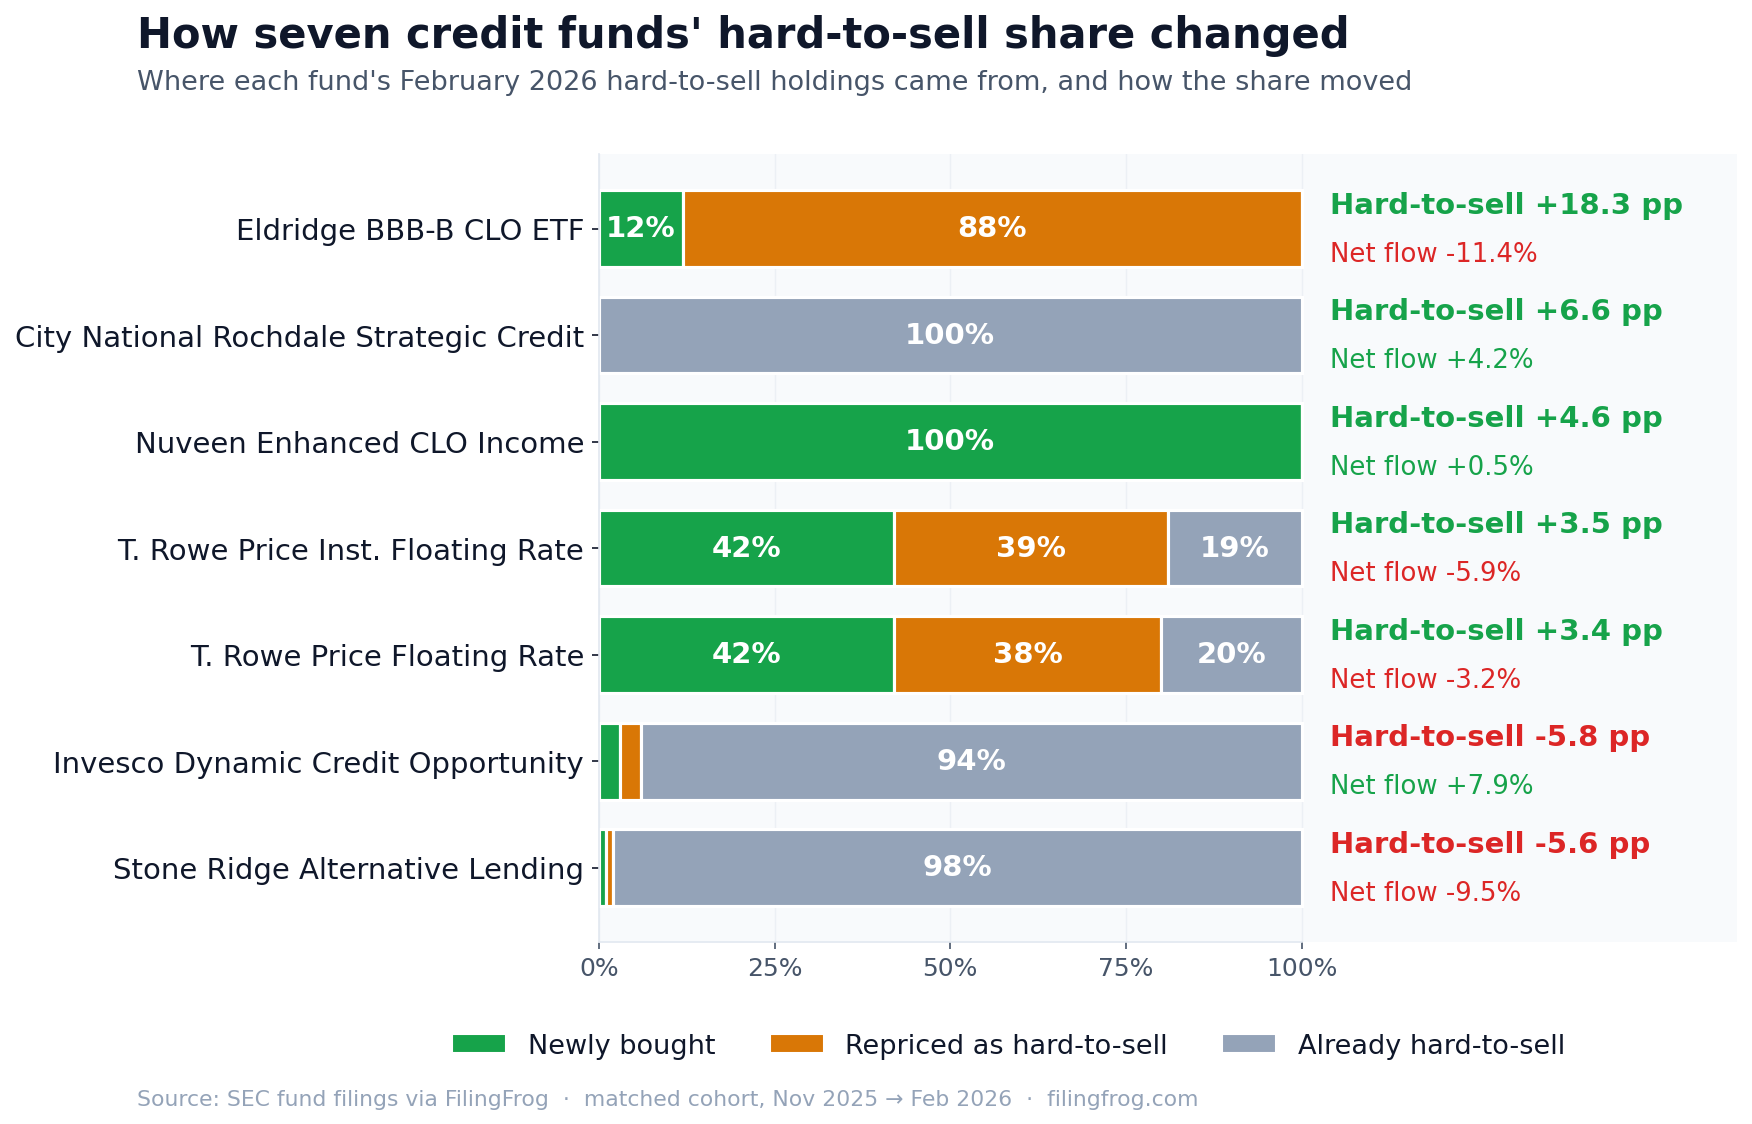
The bars sort into three groups. At Eldridge, almost the entire hard-to-sell line is paper the fund already owned — same loans, same balances, just judged harder to price three months later. At the two T. Rowe Price floating-rate funds, roughly four out of every ten dollars added to that bucket are existing senior bank debt that got reclassified the same way. At City National, Stone Ridge, and Invesco, nothing was reclassified and almost nothing was newly bought — the bucket grew (or shrank) only because the rest of the portfolio got smaller (or larger) around it.
When the same loans get harder to price
The two T. Rowe Price loan funds — Institutional Floating Rate ($4.9B) and Floating Rate ($4.1B) — saw the hard-to-sell bucket roughly double, from about 2.5% of the fund to 6%. About four out of every ten dollars in that increase is the same senior bank debt the funds held in November, at the same balance, judged harder to price by February. That's the kind of decision a fund's pricing team makes when fewer dealers are willing to quote a particular cohort of loans, or when the quotes that come back disagree more than they used to.
The same shift shows up at an unrelated manager: Credit Suisse Floating Rate High Income Fund ($1.8B) saw 41% of the increase in its hard-to-sell bucket come from leveraged loans that had been in the easier bucket the period before. Same kind of paper, different fund family, different reporting calendar — that's a sign pricing across the broader leveraged-loan market got murkier through the period, not a quirk of any one fund.
Eldridge: the entire CLO book got downgraded
The biggest single move was at the Eldridge BBB-B CLO ETF, where the hard-to-sell share jumped from 0% to 18% on a $653M fund that lost 11% of its assets to redemptions. Of the 40 holdings in the hard-to-sell bucket in February, 37 were the same CLO tranches the fund already held in November, at the same balances. The fund didn't sell a single one. They were all moved into the harder bucket together — what looks like a fund-wide repricing of the CLO book.
That's what happens when a pricing team decides observable trades are no longer reliable enough to support easy marks for an entire class of bonds. In a CLO ETF, that usually coincides with secondary trading drying up in that rating bucket. The redemptions probably accelerated the conversation, but the underlying portfolio didn't move.
When the liquid part of the fund shrinks instead
The third pattern is the one that should make a retail fund-holder pause. City National Rochdale Strategic Credit Fund moved from 64% to 70% in the hard-to-sell bucket without buying anything new there and without reclassifying anything. Every dollar in that bucket in February had already been there in November. What changed is the rest of the fund — the easier-to-sell parts shrank around a roughly stable hard-to-sell core. End result: the fund is less liquid than it was three months ago, even though the manager didn't make any visible call to take it that way.
The same dynamic plays in reverse at funds where the hard-to-sell share fell. Stone Ridge Alternative Lending Risk Premium took 9.5% in net redemptions and saw the hard-to-sell share fall from 84% to 78% — but only because the manager trimmed one large illiquid position; everything else stayed put. Invesco Dynamic Credit Opportunity looked similar but in the opposite direction: it took inflows that grew the easier-to-sell book around an unchanged illiquid core.
For funds that already sit two-thirds or more in private credit, there isn't much liquid layer left to peel off. When investors want their money back, the manager has to either trim the illiquid book directly, mark it down, or — at the most stressed funds — gate redemptions. The structural picture sits in earlier work.
Why this matters for someone who holds one of these funds
The headline number — what share of a fund sits in hard-to-sell holdings — is the cleanest single read on a credit fund's liquidity profile. But the same number can move for three very different reasons. Sometimes a manager actively buys more illiquid paper. Sometimes the same paper just gets harder to price. And sometimes investors pulling out of the easier parts of the fund leave the illiquid parts as a bigger share of what's left.
Across these seven funds last quarter, only one — Nuveen's small Enhanced CLO Income Fund, off a tiny base — got less liquid because the manager actively bought illiquid paper. For the other six, the change came from the market repricing existing holdings or from investor redemptions reshaping the portfolio. None of those required a trade. If you own one of these funds, the liquidity profile you bought into has shifted, even though no one inside the fund actively chose to take it that way. Worth checking, when the next monthly fact sheet lands, whether the bucket has kept moving in the same direction.
Explore Fund HoldingsNotes
Holdings come from the monthly portfolio filings registered funds make with the SEC. The "hard-to-sell" bucket here is what regulators and analysts call Level 3 — holdings priced using inputs that aren't observable in active markets, mostly private loans, thinly-traded structured credit, and bespoke instruments. Net flow is total subscriptions minus total redemptions, expressed as a percentage of net assets at the start of the period.
The November-to-February sample covers 2,598 funds that filed for both periods. The Credit Suisse comparison comes from a parallel October-to-January reporting cohort of 3,972 funds that file on a different fiscal calendar. Eight leveraged crypto-futures ETFs in the Volatility Shares Trust family flipped from 0% to 30–49% in the hard-to-sell bucket on the same dates, which looks like a methodology change at the fund company rather than a market move, and they're excluded. Funds under $15M in assets are also excluded — at that size a single position can dominate the calculation.
Individual fund holdings, period diffs, and history are available through the fund section.