Three Stocks, 35% of the Fund: What Growth-Index Concentration Looks Like Now
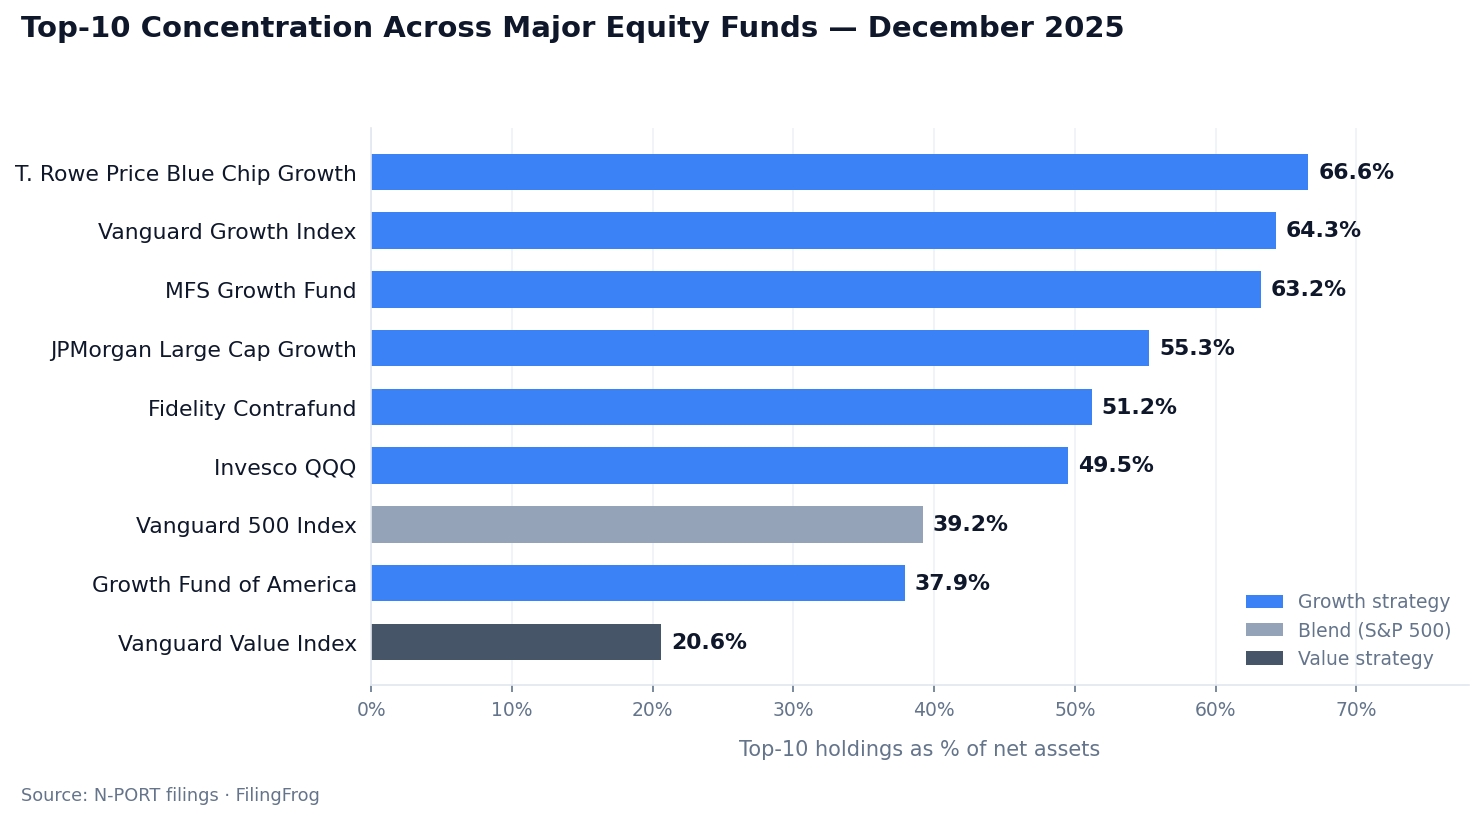
Across the largest equity growth funds in America, the same pattern is showing up in the latest disclosures: a small cluster of mega-cap technology names now accounts for roughly two-thirds of every dollar invested. T. Rowe Price Blue Chip Growth Fund finished December 2025 at 66.6% top-10 concentration. The Vanguard Growth Index Fund sits at 64.3%. MFS Growth Fund at 63.2%. This isn't an indexing quirk or a single-fund problem — it's what the entire growth category looks like at the end of 2025.
The growth-versus-value gap has never been wider
The contrast with value investing has reached an unusual extreme. Where the largest growth funds cluster between 50% and 67% top-10 concentration, the Vanguard Value Index Fund finished December at 20.6%. That's roughly a three-to-one gap — and it's been widening, not closing. Vanguard Growth alone climbed from 59.4% in June to 64.3% by December. Value barely moved.
Even the broad Vanguard 500 Index Fund, sitting at 39.2%, looks diversified by comparison. The S&P 500 has its own concentration story, but it's a different one — driven by the same mega-cap names being large in absolute terms across the whole market, not by a screen that explicitly tilts toward them.
What concentration looks like inside the funds
To see what these top-10 percentages actually represent, the Vanguard Growth Index offers a clean window because it tracks a published index without active overrides. Nvidia (NVDA) sits at 12.7% of its assets — a larger single-name position than many sector ETFs hold across dozens of companies. Apple (AAPL) is at 11.9%, Microsoft (MSFT) at 10.6%.
After that the drop-off is sharp but the names are still enormous: Alphabet (both share classes combined) at 9.7%, Amazon at 4.6%, Meta at 4.3%, Broadcom at 4.0%, Tesla at 3.8%. Just seven companies account for nearly 60% of a fund that holds 156 stocks. The pattern is broadly similar inside MFS Growth, T. Rowe Blue Chip Growth, and most other growth-screen products — different weights, same names doing most of the work.
Value looks nothing like this. JPMorgan Chase leads Vanguard Value at 3.6%, followed by Berkshire Hathaway at 3.3%. The top name in the value fund is smaller than the seventh-largest name in the growth fund.
Some active managers are deliberately spreading out
The category isn't monolithic. Fidelity Contrafund — one of the largest actively managed growth funds at $176 billion — has been moving in the opposite direction from the indexes. Its top-10 concentration fell from 58.2% in June to 51.2% by December. That's not a drift. That's a decision to reduce single-name exposure while the index it competes with does the opposite.
Growth Fund of America, the other giant at $340 billion, holds steady at 37.9% — well below the index despite running a similar large-cap growth strategy. JPMorgan Large Cap Growth is at 55.3% with just 77 holdings — a high-conviction portfolio that is still less concentrated at the top than most broad growth indexes.
Index rules matter more than they used to
And not every passive product looks the same. Invesco QQQ's top-10 concentration actually fell from 52.9% to 49.5% in Q4 2025, even as the broad growth indexes climbed. That's the Nasdaq-100's quarterly rebalancing at work — when any single name grows too large relative to the rest, it gets trimmed mechanically.
Most growth indexes don't have that mechanism. They weight purely by market cap with no cap on individual names. The bigger a stock gets, the more of the fund it becomes. It's worth comparing these funds side by side to see how different rules produce very different portfolios from similar starting points.
Explore Fund HoldingsNotes
Holdings data is drawn from N-PORT filings for the period ending December 31, 2025. Concentration figures represent the top 10 holdings as a percentage of total net assets. Individual fund holdings, historical trends, and period-over-period comparison tools are available through the fund section. Holdings for the Vanguard Growth Index Fund and Vanguard Value Index Fund can be compared directly. Cross-fund views for individual stocks like Nvidia and Apple show which funds hold each name and at what weight.