The Late 2025 Rotation: Inside Fund Flows to Metals, Bonds, and Defense

A copper mining ETF more than doubled in size. Gold and silver mining funds pulled in billions. Treasury bond ETFs absorbed nearly $10 billion in new capital over a single reporting period. And leveraged crypto products lost half their assets. These patterns all showed up in the same stretch of fund disclosures — and they may be pointing in the same direction.
Metal miners had a quarter that doesn't happen often
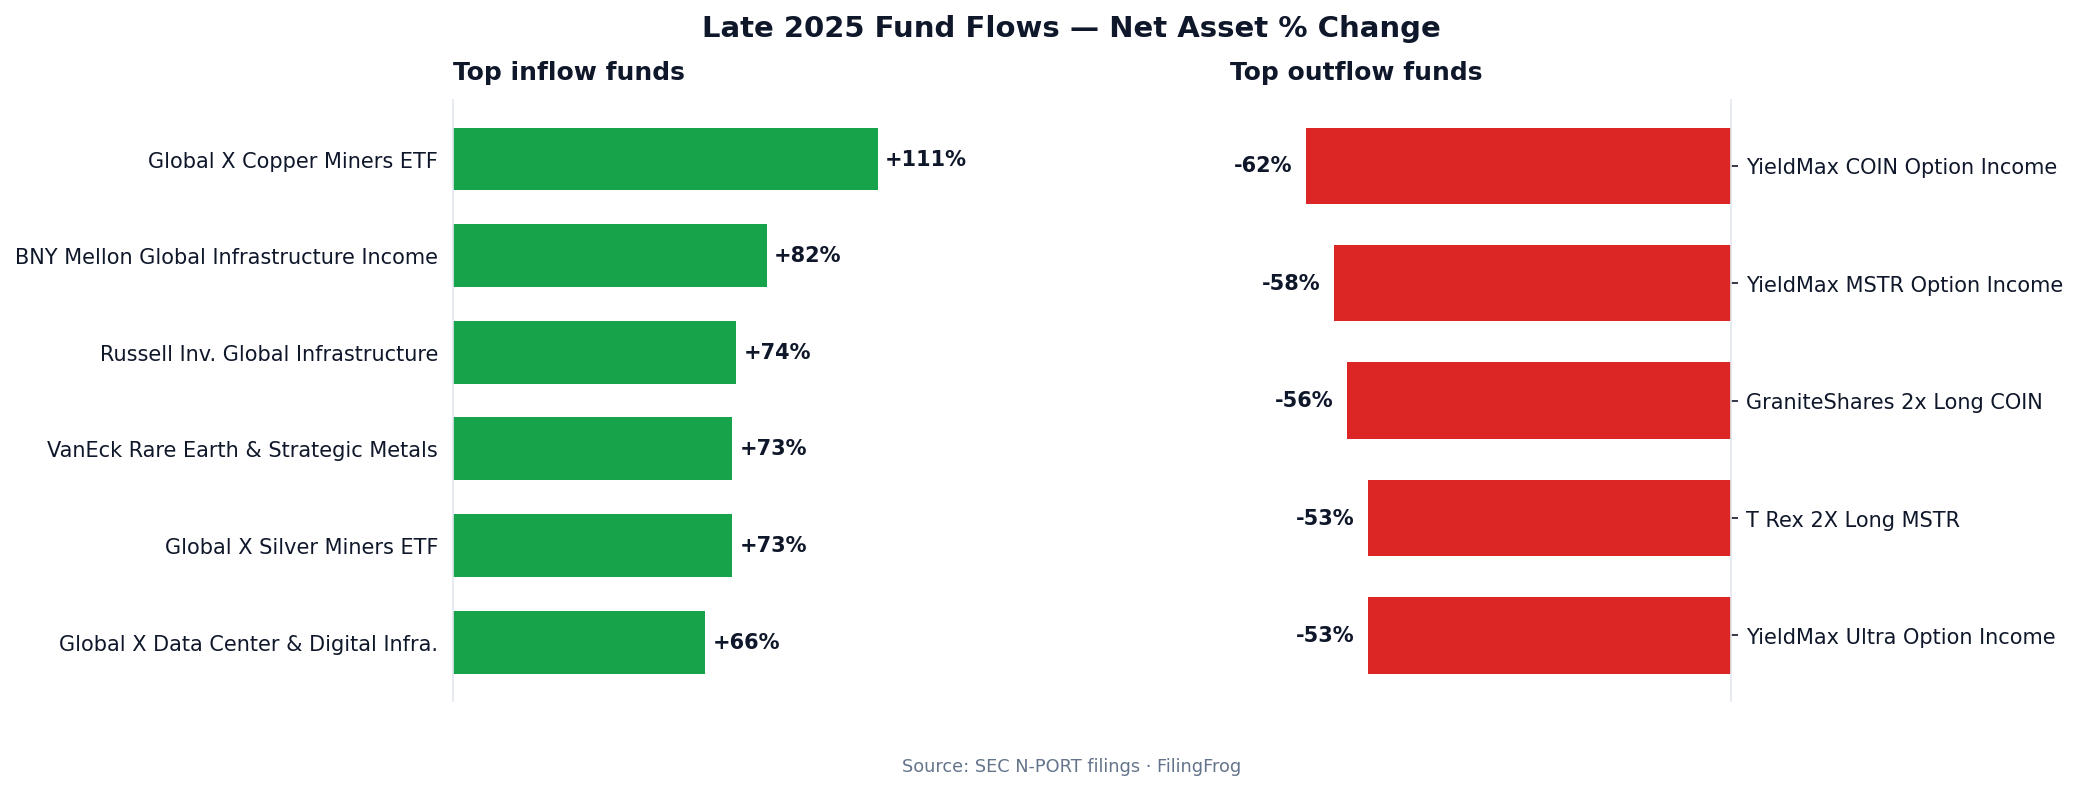
The Global X Copper Miners ETF grew from $3.4 billion to $7.3 billion — a 111% increase in net assets over three months. Global X Silver Miners ETF climbed 73%, from $3.6 billion to $6.3 billion. VanEck Rare Earth and Strategic Metals ETF rose 73% as well.
- Global X Copper Miners ETF — +111% net assets
- Global X Silver Miners ETF — +73%
- VanEck Rare Earth and Strategic Metals ETF — +73%
- VanEck Gold Miners ETF — $25.8B in assets
- First Eagle Gold Fund — $5.8B
- Amplify Junior Silver Miners ETF — $3.9B
These aren't fringe products anymore. When mining-focused funds across copper, silver, gold, and rare earths all surge at the same time, it usually reflects something broader than any single commodity's supply dynamics. Trade policy uncertainty and supply chain repositioning tend to show up in metals flows before they appear in earnings revisions.
Defense and infrastructure keep drawing capital
Global X Defense Tech ETF grew 39%, from $3.5 billion to $4.8 billion. ARK Space & Defense Innovation ETF rose 55%. On the infrastructure side, BNY Mellon Global Infrastructure Income ETF jumped 82%, and Russell Investments Global Infrastructure ETF grew 74%.
The First Trust NASDAQ Clean Edge Smart Grid Infrastructure Fund — which tracks the grid buildout needed for both AI data centers and electrification — reached $5.3 billion after growing 35%. Global X Data Center & Digital Infrastructure ETF climbed 66%. These are infrastructure plays with a technology thesis underneath them.
Bonds are absorbing serious money again
The iShares 7-10 Year Treasury Bond ETF took in enough capital to grow from $35.8 billion to $45.4 billion — a $9.6 billion increase in a single period. PIMCO Multisector Bond rose 25% to $10.2 billion. JPMorgan Active Bond ETF grew 43%. Fidelity Long-Term Treasury Bond Index Fund increased 41% to $5.9 billion.
- iShares 7-10 Year Treasury Bond ETF — +27% ($9.6B inflow)
- PIMCO Multisector Bond ETF — +25%
- JPMorgan Active Bond ETF — +43%
- Fidelity SAI Long-Term Treasury Bond — +41%
- iShares Convertible Bond ETF — +44%
Convertible bonds — the space between equity and fixed income — also drew interest. The iShares Convertible Bond ETF grew 44% to $5 billion. When convertible flows run parallel to Treasury flows, it may suggest that some capital is looking for yield with a safety net rather than choosing one side entirely.
International strategies are quietly growing
JPMorgan International Value ETF increased 56%. JPMorgan Developed International Value Fund grew 51%. Fidelity Enhanced International ETF reached $5.9 billion after a 36% jump. Capital Group International Equity ETF added 34%.
International momentum strategies joined the trend: Invesco S&P International Developed Momentum ETF grew 42% to $2.9 billion. And emerging market flows were mixed but present — the BondBloxx JP Morgan USD Emerging Markets Bond ETF rose 59%, while the Freedom 100 Emerging Markets ETF gained 31%.
The pattern across these products isn't a single trade. It looks more like a broad repositioning — funds that offer non-US exposure, commodity exposure, or some form of diversification away from US large-cap equity all saw inflows in the same period.
Leveraged and options-income products gave back their gains
On the other side of the ledger, the YieldMax COIN Option Income Strategy ETF lost 62% of its net assets. YieldMax MSTR Option Income Strategy ETF dropped 58%. The YieldMax Ultra Option Income Strategy ETF fell 53%. GraniteShares 2x Long COIN Daily ETF declined 56%.
- YieldMax COIN Option Income — -62%
- YieldMax MSTR Option Income — -58%
- YieldMax Ultra Option Income — -53%
- GraniteShares 2x Long COIN — -56%
- T Rex 2X Long MSTR — -53%
These are products built to extract yield from volatile single stocks through options strategies. When the underlying names — mostly tied to crypto — gave back their momentum, the capital left quickly. The contrast with the metals and bond fund inflows in the same period is hard to miss.
Explore Fund HoldingsNotes
Fund flow data is drawn from N-PORT filings covering the period roughly October 2025 through January 2026 (specific report dates vary by fund; each comparison uses the fund's two most recent filings). Net asset changes reflect both capital flows and market appreciation — not all growth is driven by new subscriptions. Fund-level holdings, historical data, and comparison tools are available through the fund section. Individual holdings for funds like the Global X Copper Miners ETF and iShares 7-10 Year Treasury Bond ETF can be explored in detail.