High-Conviction Portfolios: What 13F Concentration Data Shows About How Managers Bet
Eighty-six percent of institutional managers with over $50 billion in assets hold Nvidia in their top ten positions. Eighty-four percent hold Microsoft. Eighty-two percent hold Apple. Among managers under $500 million, those numbers drop to 25%, 32%, and 34% — and more than half of them don't hold a single Magnificent Seven stock in their top ten at all.
The biggest funds in the market are concentrating into the same handful of mega-cap names. Smaller managers are concentrated too — often more so — but into entirely different portfolios. The overall average hides both facts.
Two different kinds of concentration
Since Q4 2022, average top-10 concentration among $50B+ managers has climbed from 24.9% to 32.5% — a 7.6 percentage-point increase. Funds in the $10B–$50B range rose 6.6 points. Managers under $500 million, who already averaged over 60% concentration, added just 1.6 points.
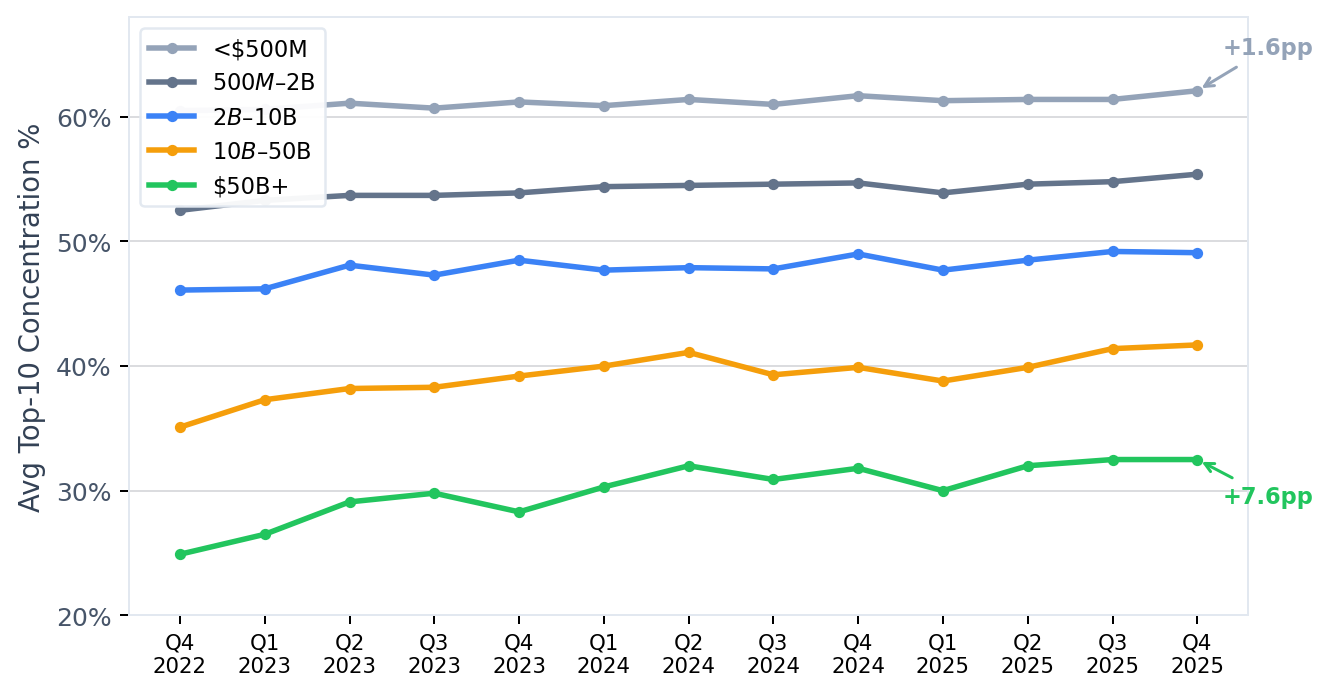
Source: SEC EDGAR 13F filings, Q4 2022 – Q4 2025. Managers with ≥$100M in disclosed AUM.
The overall market average drifted from 55.5% to 57.4% over the same period — a near-flat line that masks a divergence only visible when you split the data by fund size. Large managers are becoming significantly more concentrated. Small managers already were.
Large funds are concentrating into the same names
The rising concentration at the top of the AUM spectrum isn't idiosyncratic. It's collective. Among $50B+ managers in Q4 2025, the seven most commonly held top-10 positions are all Magnificent Seven stocks: Nvidia (86% of managers), Microsoft (84%), Apple (82%), Alphabet (75%), Amazon (71%), Meta (57%), and Broadcom (57%). Thirty-four percent of these managers hold all seven in their top ten.
Magnificent Seven: AAPL, MSFT, NVDA, AMZN, GOOGL/GOOG, META, TSLA. Q4 2025 13F data.
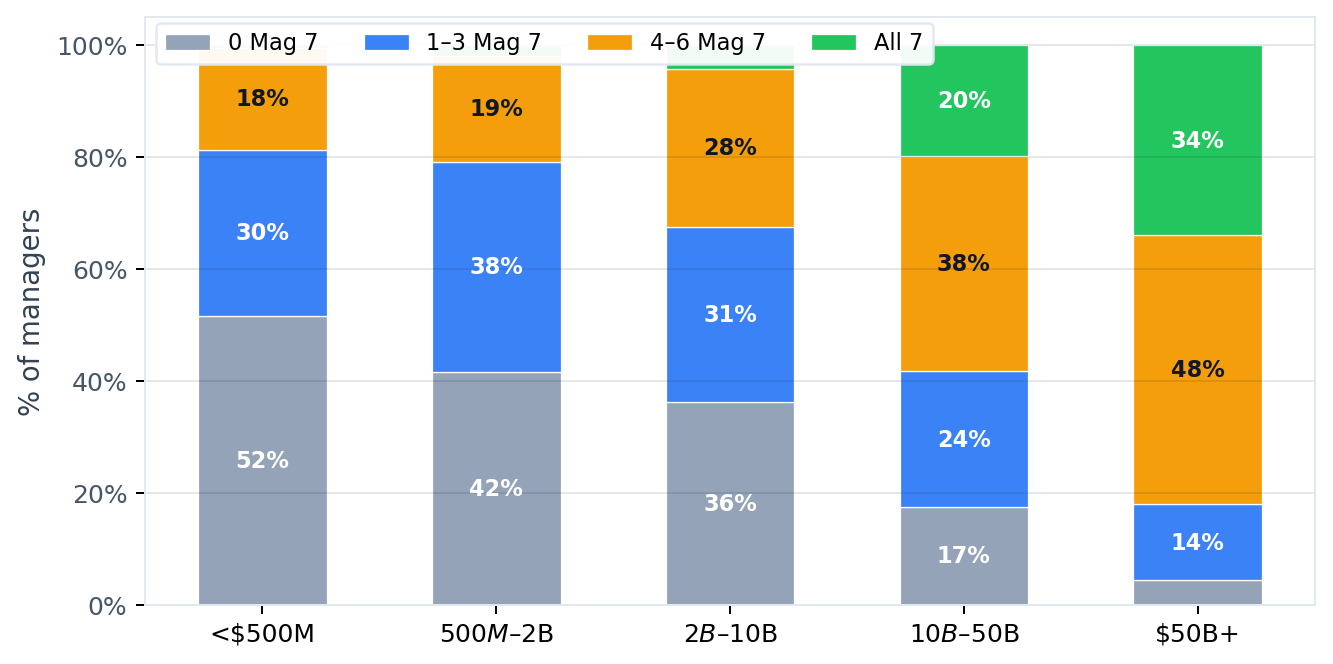
This pattern weakens steadily with fund size. At $10B–$50B, 20% hold all seven. At $2B–$10B, just 4%. Below $500 million, the figure drops to under 1%. The Mag 7 are gravitational — but mostly for the largest pools of capital.
Small managers are concentrated, but differently
Managers under $500 million average 62.1% top-10 concentration — the highest of any cohort — but their top holdings tell a different story. ETFs like SPY, IVV, QQQ, VOO, and VTI feature heavily in their top ten, alongside bonds (AGG) and commodities (GLD). These are funds running model portfolios, family offices with allocation-driven strategies, or single-strategy shops whose conviction bets are in mid-caps, small-caps, or sectors that don't appear on any mega-cap list.
Fifty-two percent of sub-$500M managers have zero Magnificent Seven stocks in their top ten. Their concentration is real — but it's pointed at a completely different part of the market.
The Q4 2025 snapshot
Across 8,372 managers with more than $100 million in disclosed assets, the distribution of top-10 concentration in Q4 2025:
The exceptions at large scale
Several large managers run extremely concentrated disclosed portfolios, and each has a distinct reason. Lilly Endowment — with $99 billion in disclosed assets — holds essentially one stock: Eli Lilly. The endowment's founding structure ties it to the Lilly family's pharmaceutical company. Similarly, Mitsubishi UFJ Financial Group disclosed $67 billion in what appears to be a single holding — a cross-holding structure common among large Japanese financial conglomerates.
TCI Fund Management holds $54 billion across just nine positions at 100% top-10 concentration — a long-term concentrated activist manager. Pershing Square Capital Management, with $16 billion across 11 positions at 99.5% concentration, is a similar case. BC Partners, Thoma Bravo, Carlyle, and One Rock Capital Partners appear with high concentration and small security counts — private equity firms whose 13F disclosures reflect stakes in portfolio companies, not broadly managed stock portfolios.
What this means
The market's largest managers are being pulled toward the same set of names by the sheer gravitational weight of mega-cap tech. A cap-weighted S&P 500 allocation now puts roughly a third of portfolio weight into ten stocks — a structural concentration that didn't exist a few years ago. Whether through passive indexing, benchmark-aware active management, or genuine conviction in the AI trade, the result is the same: the biggest funds are converging on overlapping portfolios.
Smaller managers are doing something different. They're concentrated by choice — in ETF model portfolios, single-sector mandates, family office allocations, or niche strategies that have nothing to do with the Mag 7. The headline number (57% average concentration, barely changed in three years) papers over a market where the biggest and smallest funds are concentrated for completely different reasons, in completely different stocks.
All concentration data referenced here is derived from 13F filings from Q4 2022 through Q4 2025. Manager-level AUM, security counts, and portfolio concentration figures are available for all active managers on FilingFrog through the manager screener and individual manager pages.
Screen Managers by Concentration