When Investors Left Private-Credit Funds Last Quarter, the Illiquid Loans Stayed Behind

A few months ago we looked at a handful of credit funds that had quietly gotten less liquid — not because anyone bought illiquid paper, but because the easy-to-sell parts of each portfolio had shrunk around a hard-to-sell core. That piece looked at the symptom. This one looks at the cause: what happens to the loans when investors actually ask for their money back.
When someone pulls money from a fund built on private loans, the manager sells what is easy to sell. Broadly syndicated loans, Treasuries, the cash sleeve — those go first, because the private loans are slow to move and sometimes only move at a markdown. The loans tend to stay. For the investors who remain, that can leave a fund quietly more concentrated in hard-to-value, hard-to-exit paper than the one they bought into — and if any of those loans were to sour, it is the people who stayed who carry it. Filings covering the first three months of 2026 show this at work in the funds that faced the heaviest redemptions: at most of them, the share of the fund sitting in private loans was higher at the end of the quarter than at the start.
Funds tag each holding by how easy it is to value: quoted prices in the easiest bucket, observable-but-not-quoted inputs in the middle, and the hardest-to-price paper — mostly private loans and private equity — in the bottom bucket. The share of a fund sitting in that bottom bucket is the cleanest read on what a remaining investor's money is concentrated in. The chart below shows, for the five credit funds that saw the largest net outflows last quarter, how much money left and how that illiquid share moved — both measured against the fund.
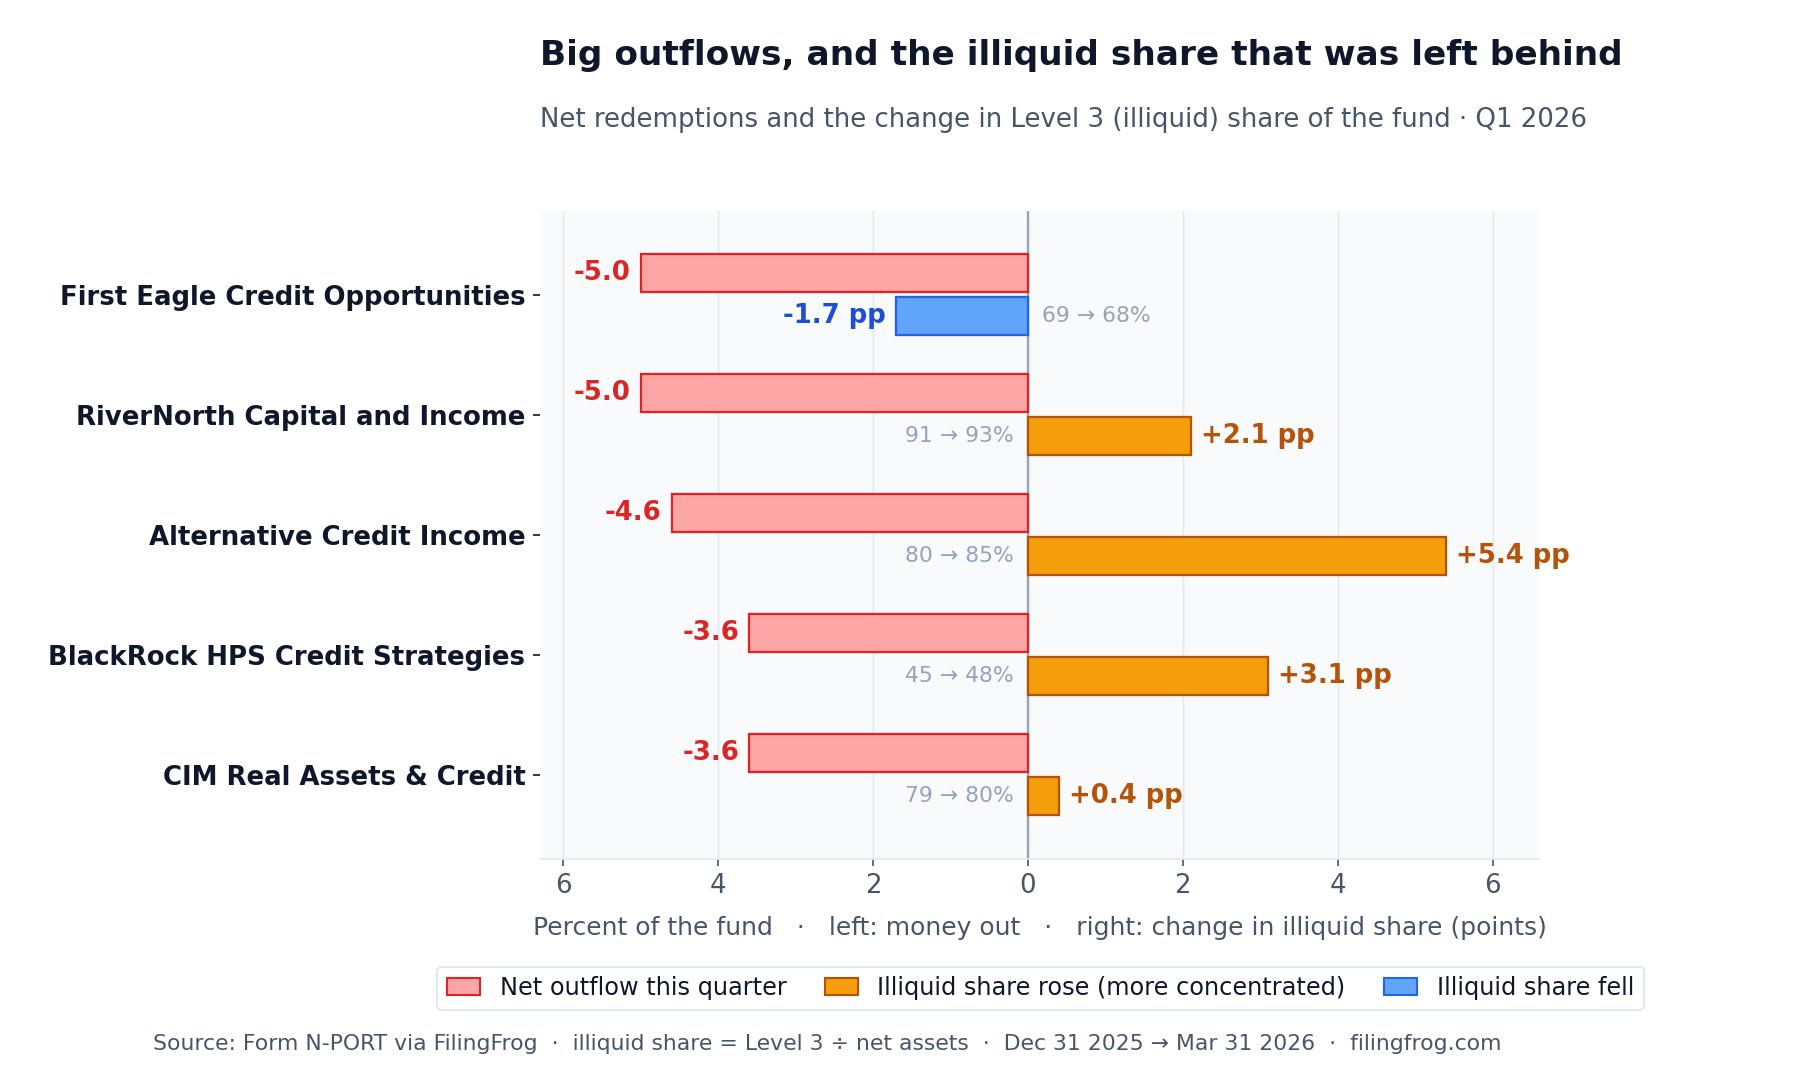
Money left every one of these funds, and at three of them the illiquid share of what remained went up: the people who stayed ended the quarter with a larger slice of their fund in private loans than they began it with. Two funds break the pattern — First Eagle's illiquid share actually slipped, and CIM's barely moved — and both are worth understanding, because they show what has to be true for the worry not to bite.
Where the cushion was thin, the loans simply took up more room
The starkest version is at the funds that barely had a liquid sleeve to begin with. RiverNorth Capital and Income Fund held about nine-tenths of its assets in the hardest-to-price bucket; Alternative Credit Income Fund, about four-fifths. When the redemptions came there was little tradable paper to sell first, so both funds simply got smaller around their loans — RiverNorth's illiquid share rose about two points, Alternative Credit's more than five. Nobody inside either fund decided to concentrate it; the private book stayed roughly where it was while everything around it shrank. A fund with one thing to sell has nowhere to put the pressure but on the people who stay.
Where the manager kept the loans on purpose
BlackRock HPS Credit Strategies Fund had the opposite starting point — more than half its assets in tradable form. It kept its private book almost exactly in place, and as redemptions shrank the rest of the fund around those untouched loans, its illiquid share climbed about three points. This is the move the worry is built on: a manager with the room to sell either the liquid holdings or the loans, leaving the loans alone, so the people who stay end up a little more concentrated in private credit than before.
Two funds where it did not happen
Not every pressured fund left its stayers more concentrated. First Eagle Credit Opportunities Fund, a roughly $700 million fund, met the heaviest outflow in the group — about five percent — by drawing down its liquid sleeve harder than any fund here, cutting tradable holdings by close to nine percent of the fund. It brought its loan book down as well — slightly faster than the fund as a whole shrank — and paid down most of its borrowing, so the illiquid share of its net assets edged down rather than up. An investor who stayed is no more concentrated in private loans than before. CIM Real Assets & Credit Fund went at it from the other side — it was the only fund here that met redemptions partly by selling its hardest-to-sell positions — but it trimmed the loan book roughly in step with the fund's overall shrinkage, so its illiquid share finished about where it started. Neither stayer ended up more concentrated, for opposite reasons.
When the dollar figure looks worse than it is
The largest loan decline of all came from a fund with only modest outflows, and it is worth walking through because the dollar figure points the wrong way. Cliffwater Corporate Lending Fund — about $31 billion, run by the advisory firm Cliffwater — received redemption requests for roughly 14% of its shares in the quarter, well beyond what it offers to buy back. It repurchased about 7%, the most it could, and the rest of the would-be sellers waited in line. Over the same three months its private-loan book fell from about $36.7 billion to $33.1 billion — close to a tenth, the largest dollar decline of any fund here.
But the loans that ran off were not sold to fund redemptions; they were repaid — and the proceeds went mostly to pay down nearly $1.9 billion of borrowing. The quality of that run-off matters too: of the roughly $3.6 billion decline, about $0.9 billion was loans that left the book entirely and about $2.65 billion was repaid or sold near carrying value, with only about $38 million of write-downs and not a single loan relabeled into an easier-to-value bucket. So the headline — a credit giant shedding billions in loans into a wave of redemptions — describes a balance sheet getting smaller and less levered at par, not a manager dumping illiquid paper to raise cash. On the measure that matters to the people who stayed, the fund grew less concentrated in private loans, not more.
The big private-credit names did not all look alike
The sponsors most associated with this corner of the market — Apollo, Ares, Blue Owl — did not show up in the same place. Ares, through the $4.9 billion CION Ares Diversified Credit Fund (CADC), is where redemption pressure landed among the household names; it met modest outflows by cutting its tradable loan sleeve by about $400 million while its private book barely budged, and parked much of the cash rather than redeploying it. The other two were still growing. Apollo Diversified Credit Fund took in more money than it paid out in every quarter of the past year and tilted a little further toward private credit as it put the new money to work. Blue Owl Alternative Credit Fund, the firm's first fund of this kind, launched in 2025 and pulled in fresh money with almost no redemptions, growing from about $1.3 billion to $1.5 billion in the quarter. "Facing redemptions" and "holding private credit" turned out to be different things last quarter, fund by fund.
Some bottom-bucket moves had nothing to do with redemptions
A few funds posted big moves in their illiquid bucket that had nothing to do with selling loans to raise cash, and they are worth setting apart. Partners Group Private Equity, a roughly $16 billion fund, saw its illiquid holdings fall by about $0.9 billion — much of it marks being written down rather than positions sold. A markdown lowers the value of what a fund holds without anything leaving it: the market repricing the book, not the manager trimming it. Other funds added to their illiquid bucket even as money left — SEI's structured-credit fund and Oaktree Diversified Income Fund each grew their hardest-to-value holdings over the quarter by adding positions, the opposite of shedding loans to meet redemptions. And in big daily-traded growth funds such as Fidelity Contrafund, a sharp markup on private stakes like SpaceX lifted the value of those holdings — its SpaceX position alone rose by nearly $3 billion over the quarter — a pattern covered in earlier work. None of these belong in a count of funds that sold to meet redemptions.
None of this is the same as the loans going bad. Markdowns across these funds were small last quarter; the private books mostly held their marks. The shift is in concentration, not in quality — redemptions leave the people who stay holding more of the part of the fund that is hardest to value and hardest to exit, whatever those loans turn out to be worth. That is the thing worth checking when the next monthly report lands: not whether the manager dumped the loans, but whether the liquid cushion that lets them avoid it is still there.
Explore Fund HoldingsNotes
Holdings come from the monthly portfolio reports registered funds file with the SEC (Form N-PORT). The illiquid, or Level 3, bucket is holdings priced with inputs that are not observable in active markets — mostly private loans, private equity, and bespoke structured credit. Figures compare December 31, 2025 with March 31, 2026, the two most recent calendar quarter-ends. The starting universe is the roughly 140 funds larger than $50 million that held at least 20% of net assets in Level 3; two dozen of those saw net outflows (share subscriptions minus redemptions) over the quarter. The chart shows the five with the largest net outflows whose Level 3 change reflected actual trading and retention rather than repricing.
The illiquid share plotted is Level 3 divided by a fund's net assets, before and after the quarter. That is deliberately the figure a remaining investor experiences: their money is a claim on net assets, so Level 3 as a share of net assets is how concentrated that claim is in hard-to-value paper. It can rise even when a fund sells none of its loans — if redemptions shrink the rest of the fund around an untouched private book, the share goes up on its own, which is why this measures the outcome for whoever stayed rather than whether a manager deliberately sold illiquid paper. (A separate question — did a fund dump its loans disproportionately to meet redemptions? — is better judged against priced holdings, because deleveraging can lift the share of net assets on its own; by that test none of these funds sold their loans faster than they shrank. A few heavily leveraged funds, such as Cliffwater, carry Level 3 above 100% of net assets; none of the five on the chart do.) For the featured funds, each Level 3 change was decomposed at the holding level into positions exited, repaid or sold near carrying value, marked up or down, and reclassified between buckets; funds whose move was chiefly markdown (Partners Group) or new buying (SEI, Oaktree) are discussed separately rather than counted as sellers. Several mechanical effects were set aside: exchange-traded funds, whose reported redemptions reflect authorized-participant turnover rather than investors leaving; one real-estate interval fund whose large move came from building a liquidity buffer; one fund whose Level 3 line carries a data artifact; and one feeder-structured fund that reports a single master-fund position. Business development companies such as Blue Owl Credit Income, Apollo Debt Solutions, and Ares Strategic Income file different reports and are not part of this dataset.
Individual fund holdings, period-over-period diffs, and history are available through the fund section. Related reading: how a handful of credit funds got less liquid without trading a thing and the structure of private-credit liquidity.