Paid in Kind: BDC Loan Portfolios Are Deferring More Interest as Yields Fall (2025)

When a borrower can't — or would rather not — pay its loan interest in cash, the lender can let it pay "in kind": the interest is added to the loan balance instead of arriving as money. It still counts as income. The lender books it, it lifts the reported value of the loan, and it can help fund the dividend — even though no cash has changed hands.
It's a normal feature of private lending, and lately a closely watched one. By late 2025, more than one out of every eight dollars these lenders had out on loan sat in something carrying that feature — a share that drifted back up over the past year, even as the cash yields on those loans were falling.
Interest that doesn't arrive as cash
Pay-in-kind interest is an ordinary tool in private lending. A growing company would rather reinvest its cash than send it to a lender; a lender willing to wait can charge more for the privilege and add the deferred interest to the principal. The cash, in theory, arrives later — when the loan is refinanced, the business is sold, or the debt comes due.
The wrinkle is in the accounting. Under the rules these lenders follow, pay-in-kind interest is recorded as income the moment it accrues, the same as a cash coupon. That income lifts reported earnings and net asset value, and most of these funds are required to pay out the bulk of their income as dividends. So a payout can be funded, on paper, by income that hasn't been collected — and that may never fully arrive if the borrower can't convert the accrued value into cash when the loan matures.
More than an eighth of the book, with a wide spread
The data covers more than 200 business development companies — the publicly registered funds that make up a large slice of U.S. private credit. About 125 of them reported the breakdown at September 2025, and across that group roughly 13% of portfolio value sat in loans carrying a pay-in-kind feature.
That average hides an enormous range. Thirteen of those funds carried the feature on more than a fifth of their portfolios; thirty carried it on less than 5%. The highest concentrations sit with venture and technology lenders, where deferring cash is built into the loan — but several of the largest diversified lenders are well into the double digits.
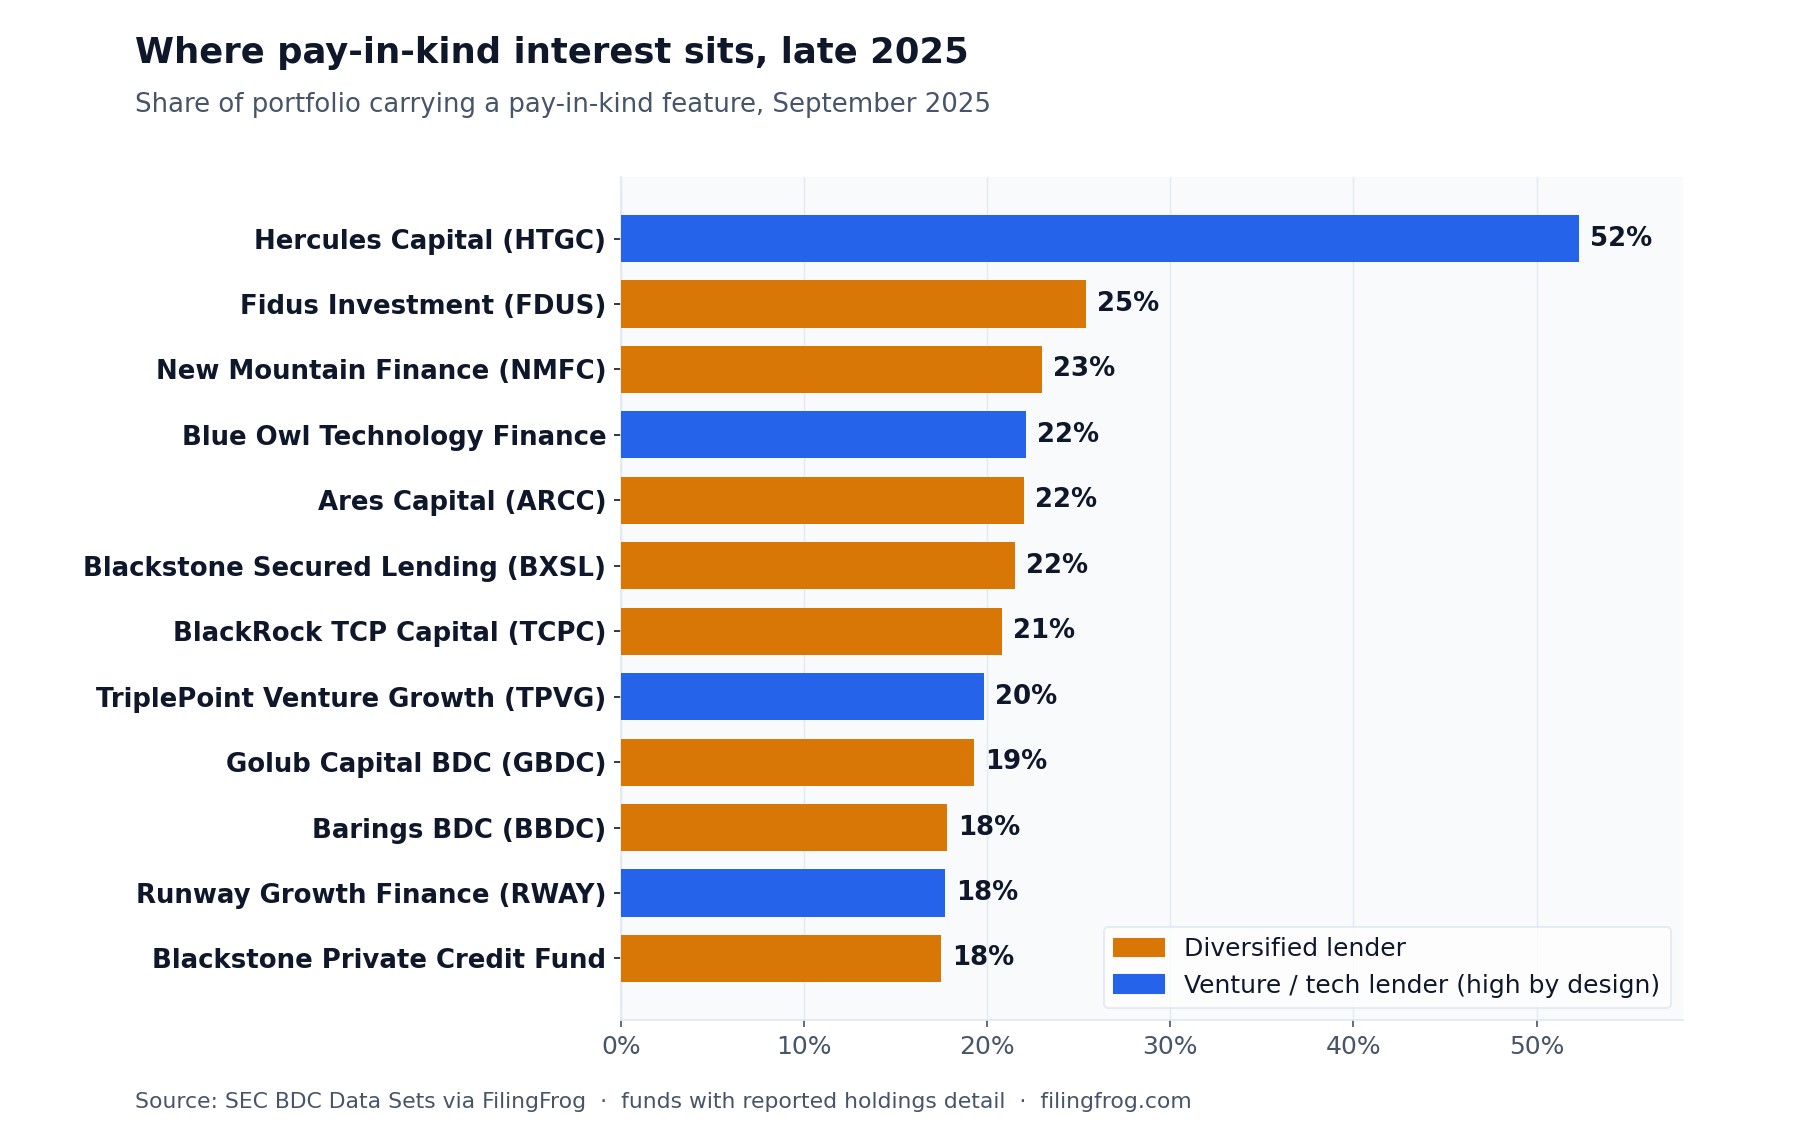
Hercules Capital (HTGC), a venture lender, sits at the top above 50% — a level that reflects how its loans are built rather than a sudden change. Among the large diversified names, Ares Capital (ARCC) and Blackstone Secured Lending (BXSL) each carry the feature on about 22% of their portfolios, Golub Capital BDC (GBDC) around 19%, and the largest fund of all, Blackstone Private Credit Fund — about $47 billion in net assets — roughly 18%. This is footprint, though, not income: a high share of loans carrying the feature need not mean a fund leans heavily on non-cash income, and ranked by income the order looks quite different — a point we return to below.
Down from the 2024 peak, back up in 2025
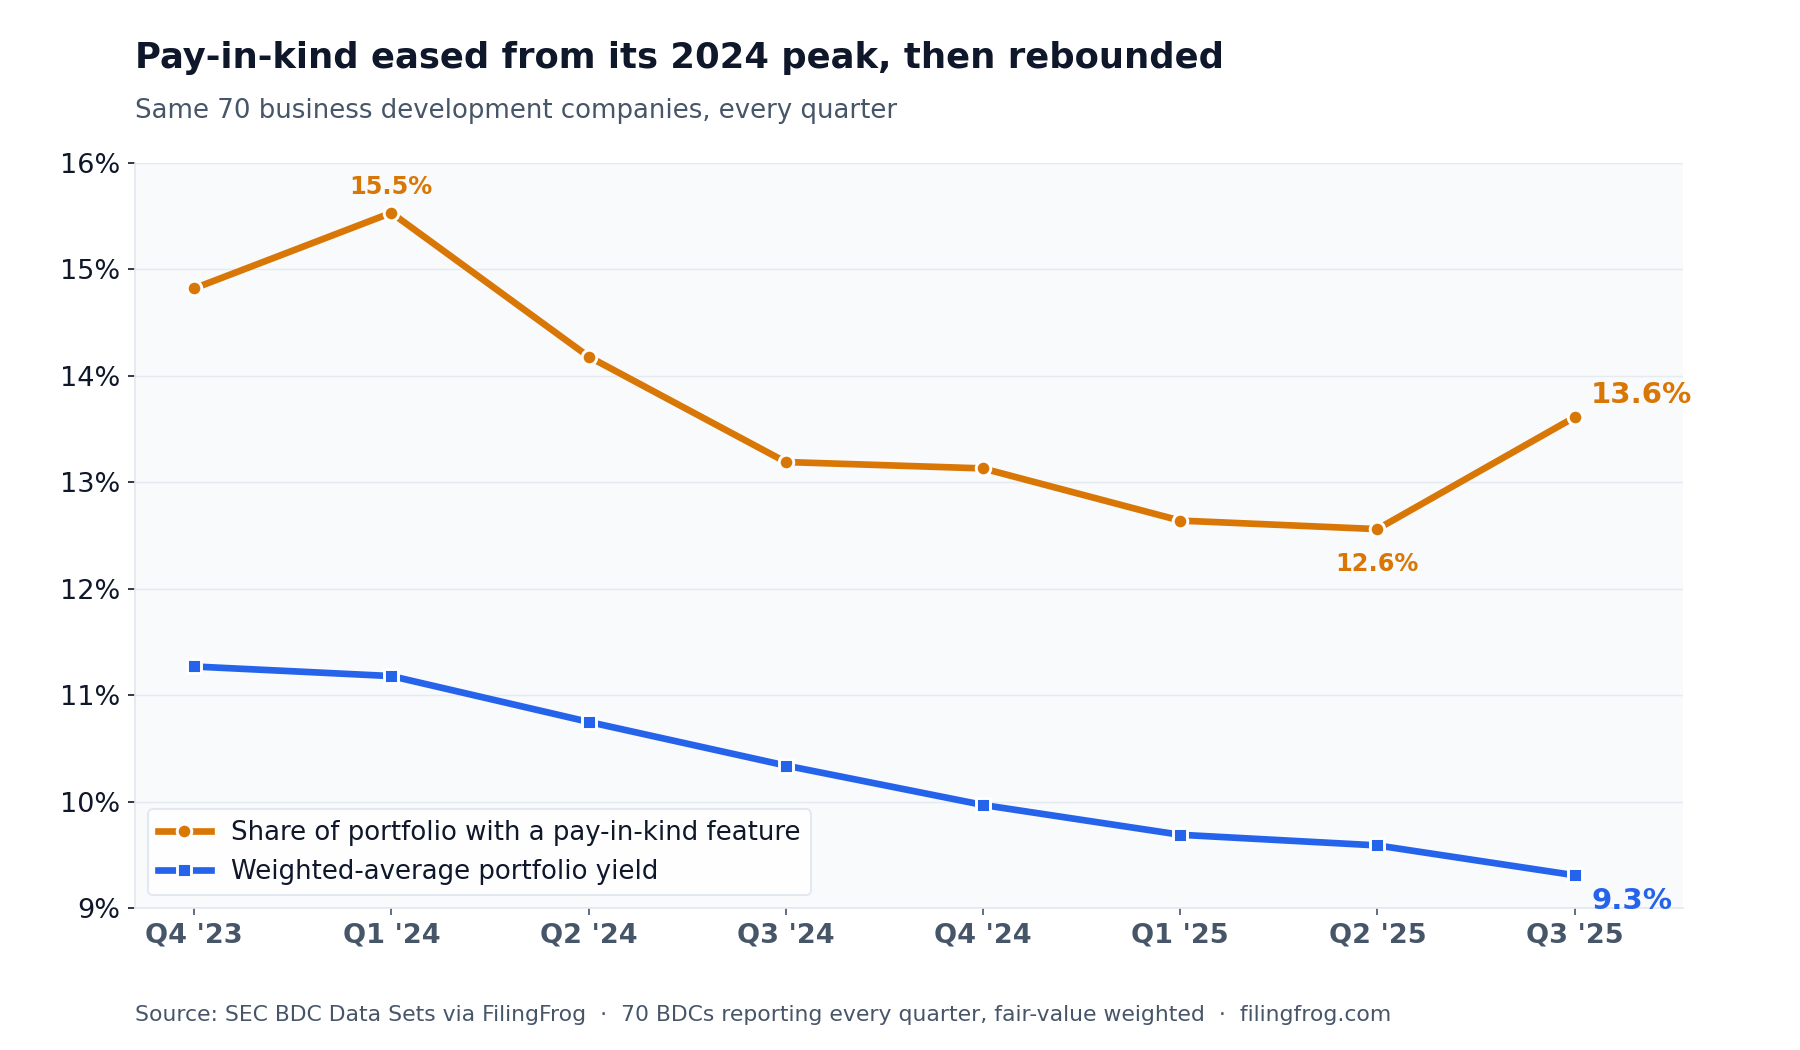
The trend didn't move in a straight line. The line below follows a fixed set of 70 funds that report the breakdown every quarter, so it reflects real change rather than shifts in which funds report. On that basis the pay-in-kind share rose into early 2024, peaking near 15.5%, then eased through the rest of the year and into 2025 — down to about 12.5% by mid-year — before turning back up to roughly 13.5% by the third quarter. It still sits below where it stood at the start of 2024.
The yield those same funds earned on their portfolios tells a simpler story: a steady decline, from about 11.3% at the end of 2023 to 9.3% by late 2025, as the Federal Reserve cut its policy rate from a 5.25–5.50% peak. Most of these loans float with that rate. So the recent leg up in deferred interest came alongside shrinking cash coupons — less cash per dollar lent, and a slightly wider slice of what's left arriving as something other than cash.
Up at some lenders, down at others
The averages are calm; the names underneath them are not. The move over the past year was concentrated rather than broad. Blackstone Secured Lending added the most, climbing from about 13% to 22%; BlackRock TCP Capital (TCPC) rose from 14% to 21%, Blackstone Private Credit Fund from 12% to 18%, and Ares and Golub each added a couple of points. Others moved the opposite way — Blue Owl Capital (OBDC) fell from about 21% to 16%, its technology fund pulled back, and Goldman Sachs BDC (GSBD) and Oaktree Specialty Lending (OCSL) each edged lower.
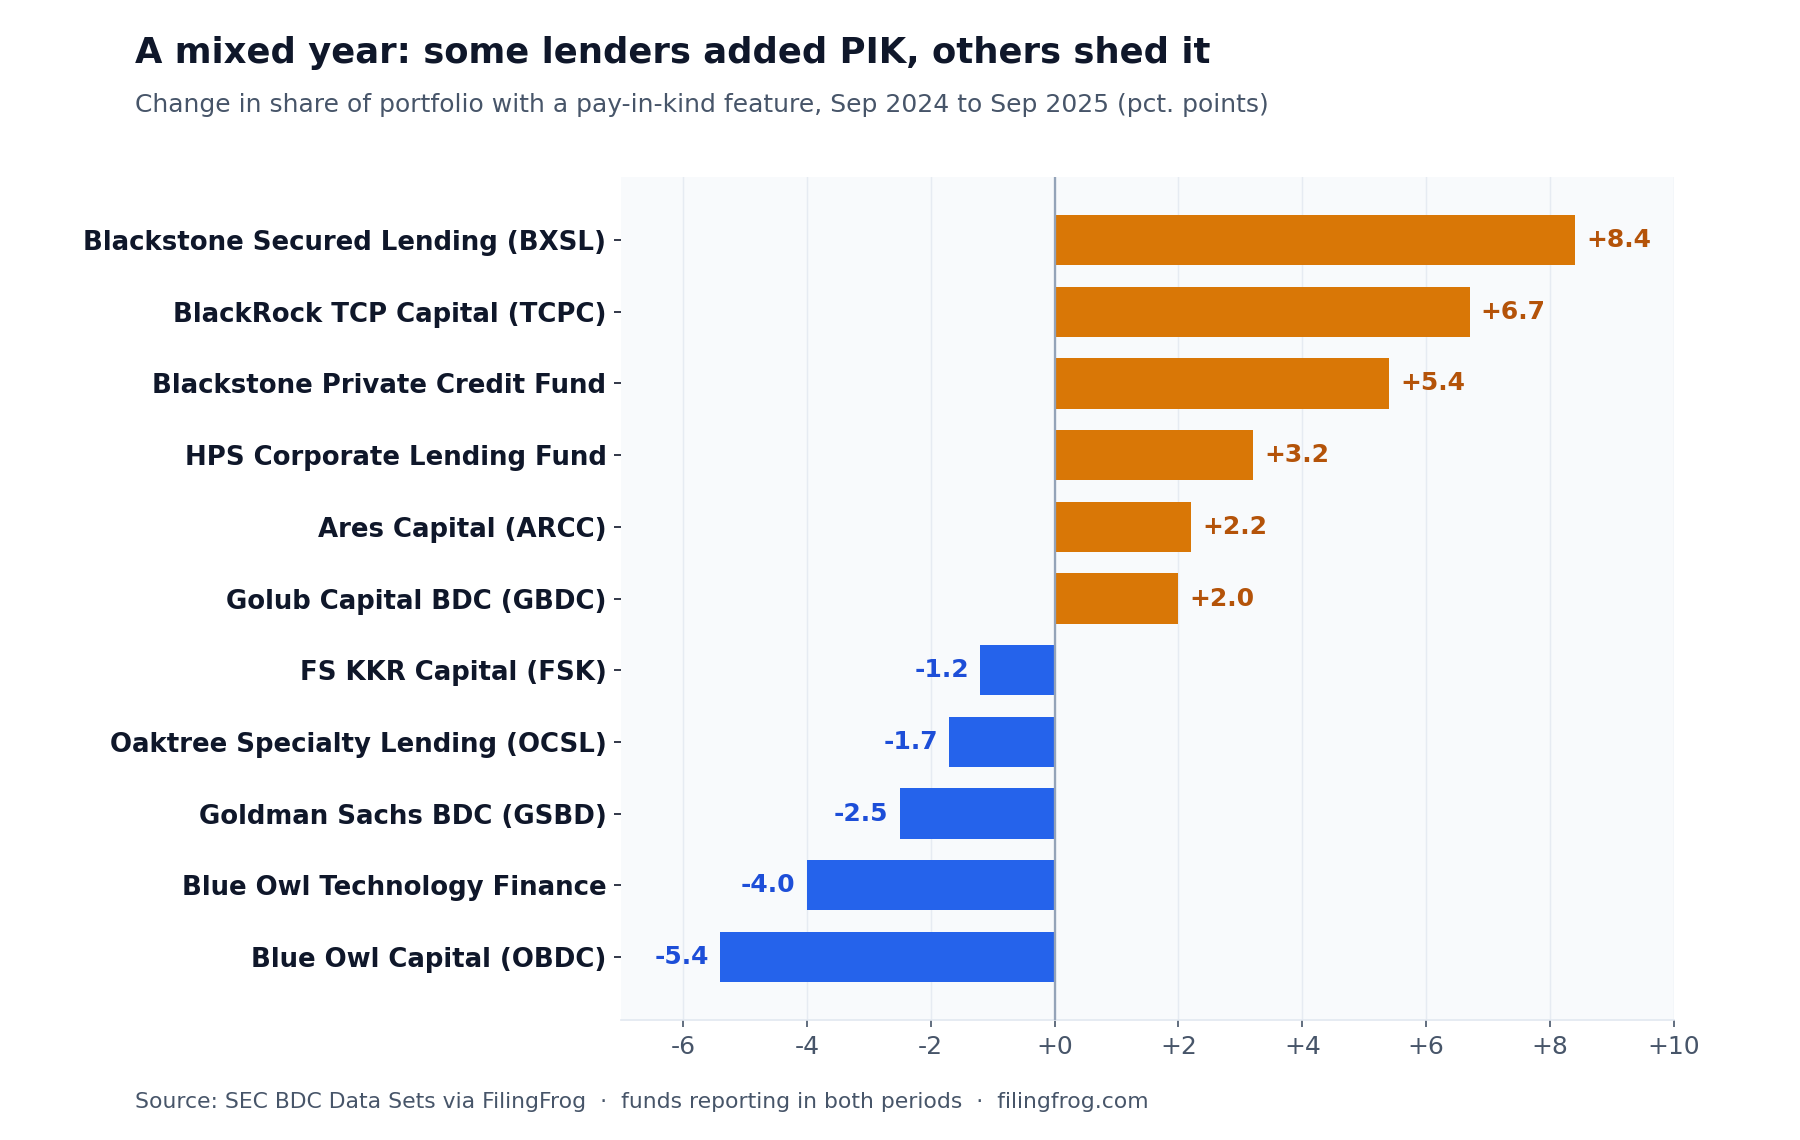
That split — some lenders leaning into deferred interest while others trim it — is the part worth sitting with. It's the same pattern outside analysts have described: a gently rising average that sits on top of very different books.
Some of it is by design — and some isn't
Not all pay-in-kind interest carries the same meaning. In venture and technology lending it's a standard feature, written into the loan from the start: a young company reinvests its cash to grow, and the lender takes part of its return at the back end. For these lenders a high share is expected, not a warning. Hercules Capital, Blue Owl's technology fund, TriplePoint Venture Growth (TPVG) and Runway Growth Finance (RWAY) all run well above the industry average for that reason.
The bigger diversified lenders make a similar point about their own books. On recent earnings calls, Ares Capital said roughly 90% of its pay-in-kind interest was structured into deals at the outset rather than added later; Golub Capital said the "vast majority" of its own came from terms set at underwriting; Blue Owl's technology fund put the figure above 98%. Interest negotiated up front, on a healthy borrower, is a pricing choice.
The part that draws attention is the interest added afterward — when a borrower that had been paying cash switches to paying in kind because it can no longer manage the cash. That conversion is harder to see from the outside, and it's the piece watchdogs have flagged. The International Monetary Fund estimated last year that around 40% of private-credit borrowers were generating negative free cash flow, up from roughly a quarter in 2021. Rating agencies have pointed to the same thing: a low headline default rate can sit on top of borrowers who are quietly deferring what they owe.
Covered on paper, not always in cash
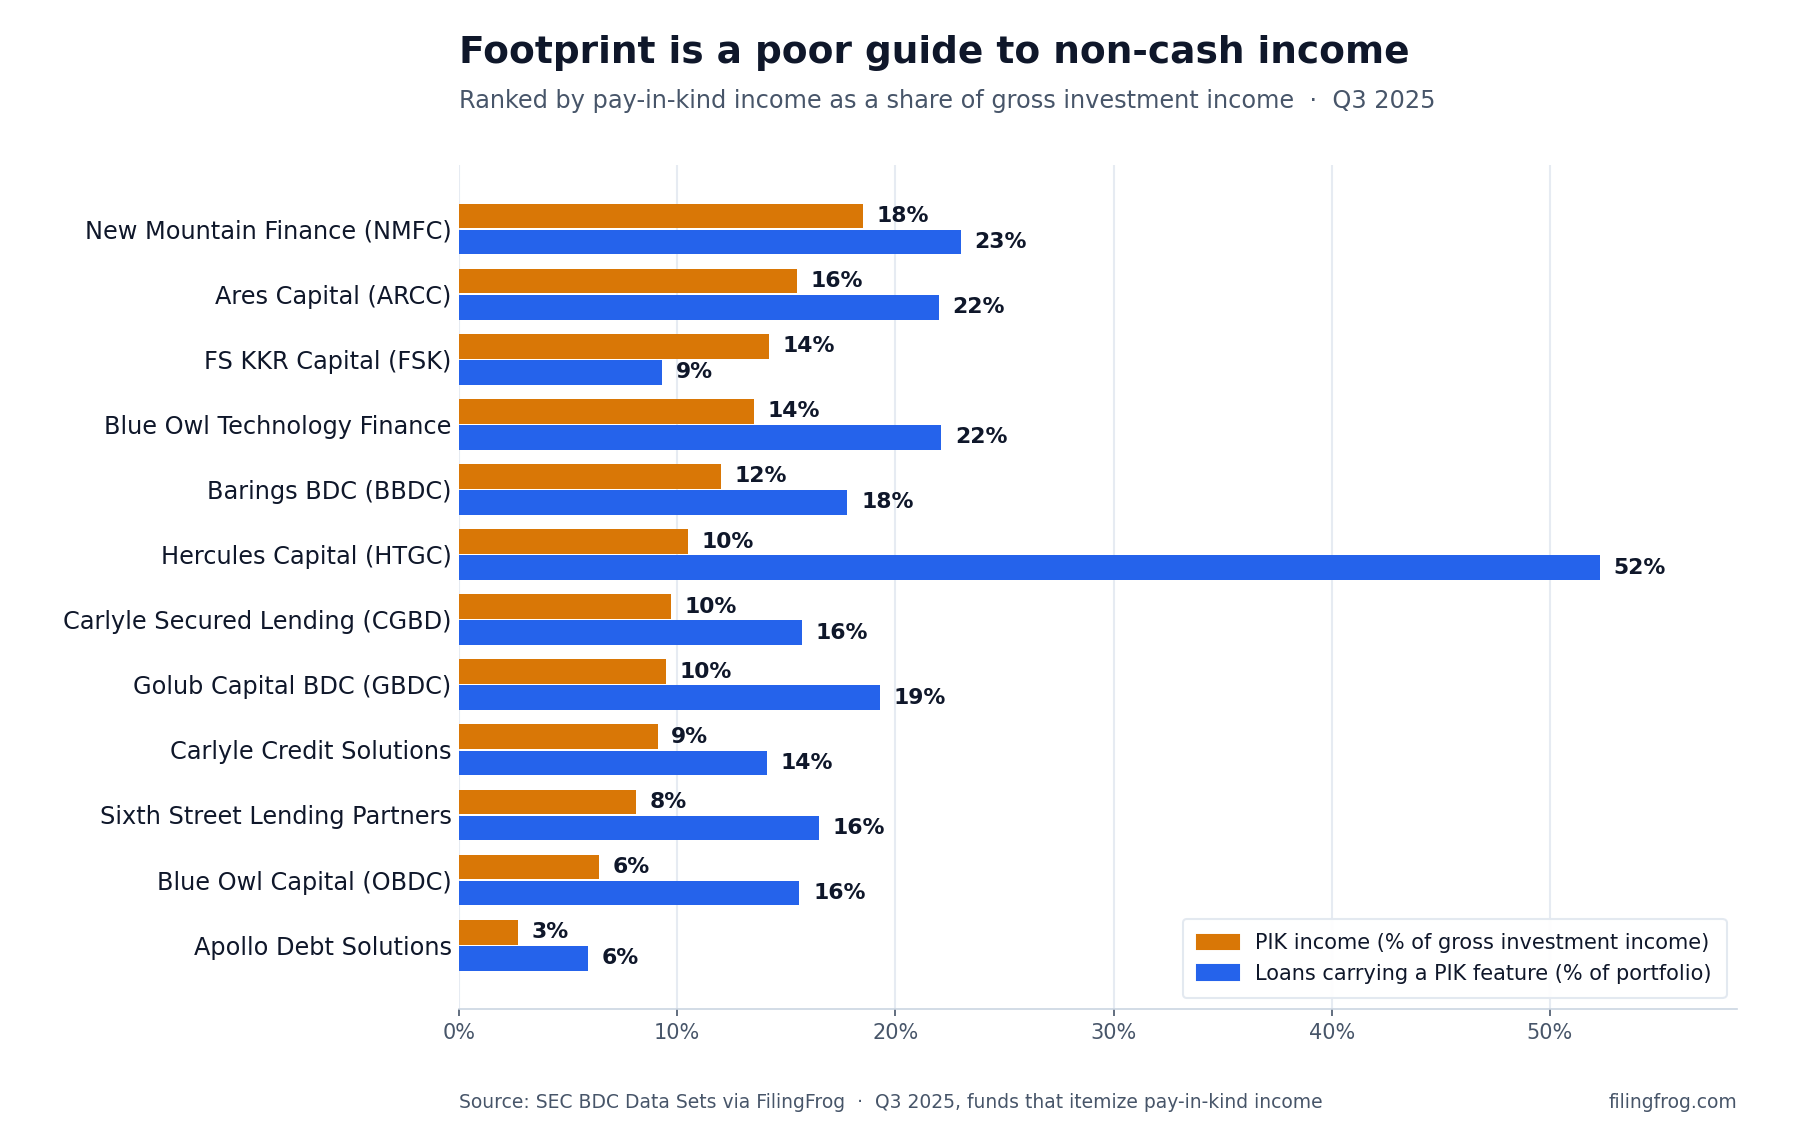
Everything so far has measured the footprint — the share of a portfolio that carries a pay-in-kind feature. What reaches the dividend is a different question: how much of a fund's income actually arrives as non-cash. The two aren't the same. Hercules carries the feature on half its loans, but only about a tenth of its income is paid in kind; some funds with a far smaller footprint, like FS KKR Capital (FSK), take roughly a third of their net income that way. Across the funds that report it, non-cash pay-in-kind runs about 8% of gross investment income — and because dividends are paid out of net income, after expenses, closer to 16% of it.
Ranking the funds by that income share, rather than by footprint, reorders them. Hercules — the runaway leader on footprint, carrying the feature on more than half its loans — sits mid-pack once you count the income that actually arrives as non-cash, around a tenth of its gross investment income. The top of the income ranking is a different mix: New Mountain Finance (NMFC) and Ares carry both a large footprint and heavy income reliance, each drawing between 15% and 19% of gross investment income in kind, while FS KKR climbs in with about 14% despite a feature on under a tenth of its book. Footprint, in short, can overstate how much a fund leans on non-cash income, understate it, or roughly match — and several of the largest names, the Blackstone funds and BlackRock TCP among them, don't itemize their pay-in-kind income and so can't be placed on this measure at all.
That matters because these funds are bought for their dividends, and pay-in-kind income counts toward the earnings a dividend is measured against — even though it isn't cash. So a payout can look covered on reported income while the cash behind it falls short. In full-year 2025, across the large funds that itemize their pay-in-kind income, net investment income covered the dividend about 0.95 times on average — but stripping out the interest paid in kind, cash income covered only about 0.78 times. Only eight of those sixty-odd funds covered their dividend in cash.
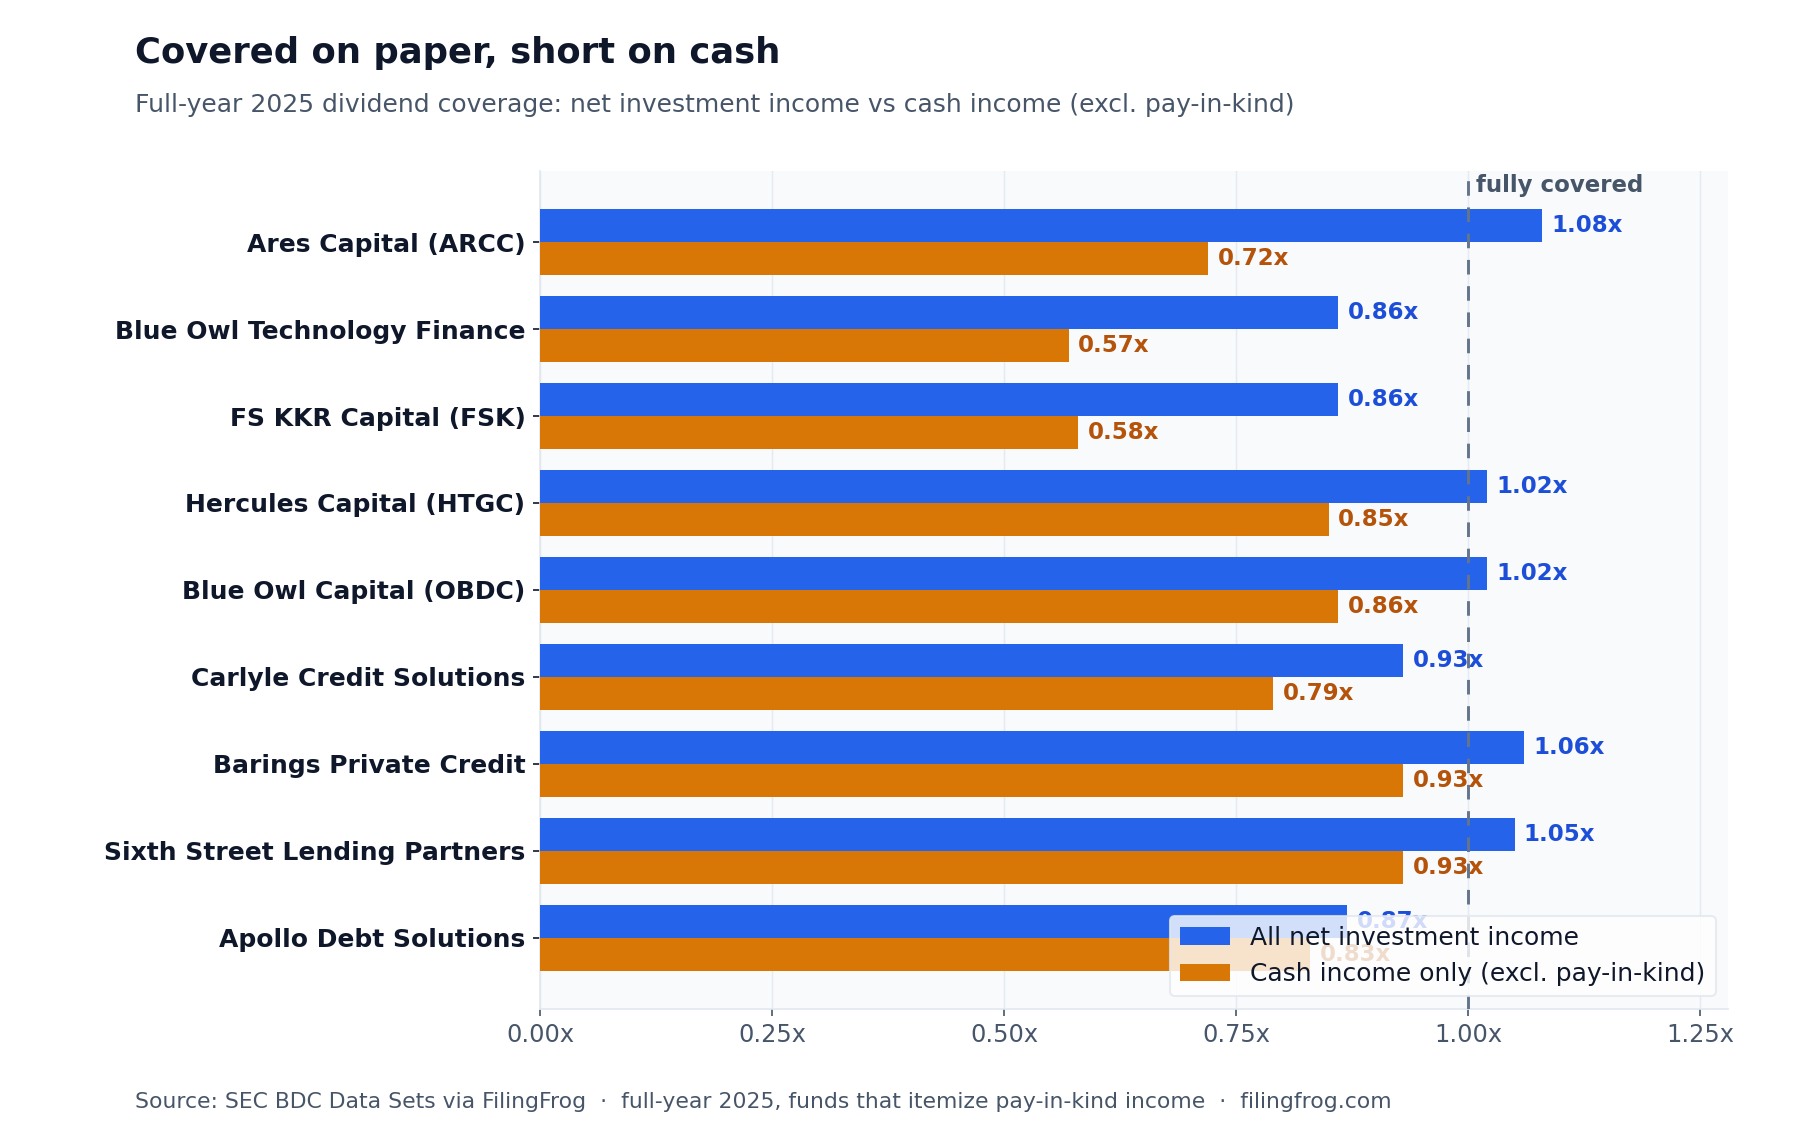
It is clearest at the largest names. Ares Capital earned enough in 2025 to cover its dividend 1.08 times over — but about a third of that income was paid in kind, so in cash the coverage was roughly 0.72 times. Blue Owl's technology fund covered 0.86 on paper and 0.57 in cash; FS KKR, 0.86 and 0.58. It isn't universal — Blue Owl Capital (1.02 and 0.86) and Hercules (1.02 and 0.85) lean less on non-cash income, and a few funds collect nearly all of their dividend in cash. The gap between the two bars is the part worth watching: reported coverage can sit near 1.0 while the cash behind it runs well under. Several funds trimmed their payouts during the year, including the first cut in the history of the largest BDC.
Explore BDC PortfoliosNotes
Portfolio data is drawn from the SEC's BDC Data Sets — XBRL-derived filings from business development companies, covering more than 200 funds. The pay-in-kind figures measure the share of a fund's portfolio, by fair value, invested in loans that carry a pay-in-kind interest feature; they describe exposure, not the share of a fund's income that is non-cash. About 125 funds reported the breakdown at September 2025. The trend chart uses a fixed panel of 70 funds that report it in every quarter shown, so the line reflects real change rather than shifts in who reports; the one-year comparison covers funds reporting in both September 2024 and September 2025. Composition detail is most complete a couple of quarters in arrears, as annual reports are filed. Dividend coverage compares a fund's net investment income to its distributions; cash coverage removes the pay-in-kind income the fund reports — interest and dividends accrued but not received — before dividing by distributions. The income-share figures (pay-in-kind as a percent of gross and of net investment income) and the coverage figures are full-year 2025, for the roughly 60 large funds that itemize pay-in-kind income; they measure how much of income is non-cash, which differs from the portfolio-feature share charted earlier (how many loans carry the feature). The per-fund chart that ranks funds by income share compares, for the third quarter of 2025, each fund's portfolio-feature share against its pay-in-kind income as a percent of that quarter's gross investment income, for the twelve named funds reporting both; quarterly income shares track the full-year figures closely. Context on interest rates and the origination-versus-amendment split draws on the IMF's October 2025 Global Financial Stability Report, rating-agency commentary, reporting by PitchBook and Octus, and company earnings disclosures. Individual fund portfolios, schedules of investments, and quarter-over-quarter changes are available in the BDC section.